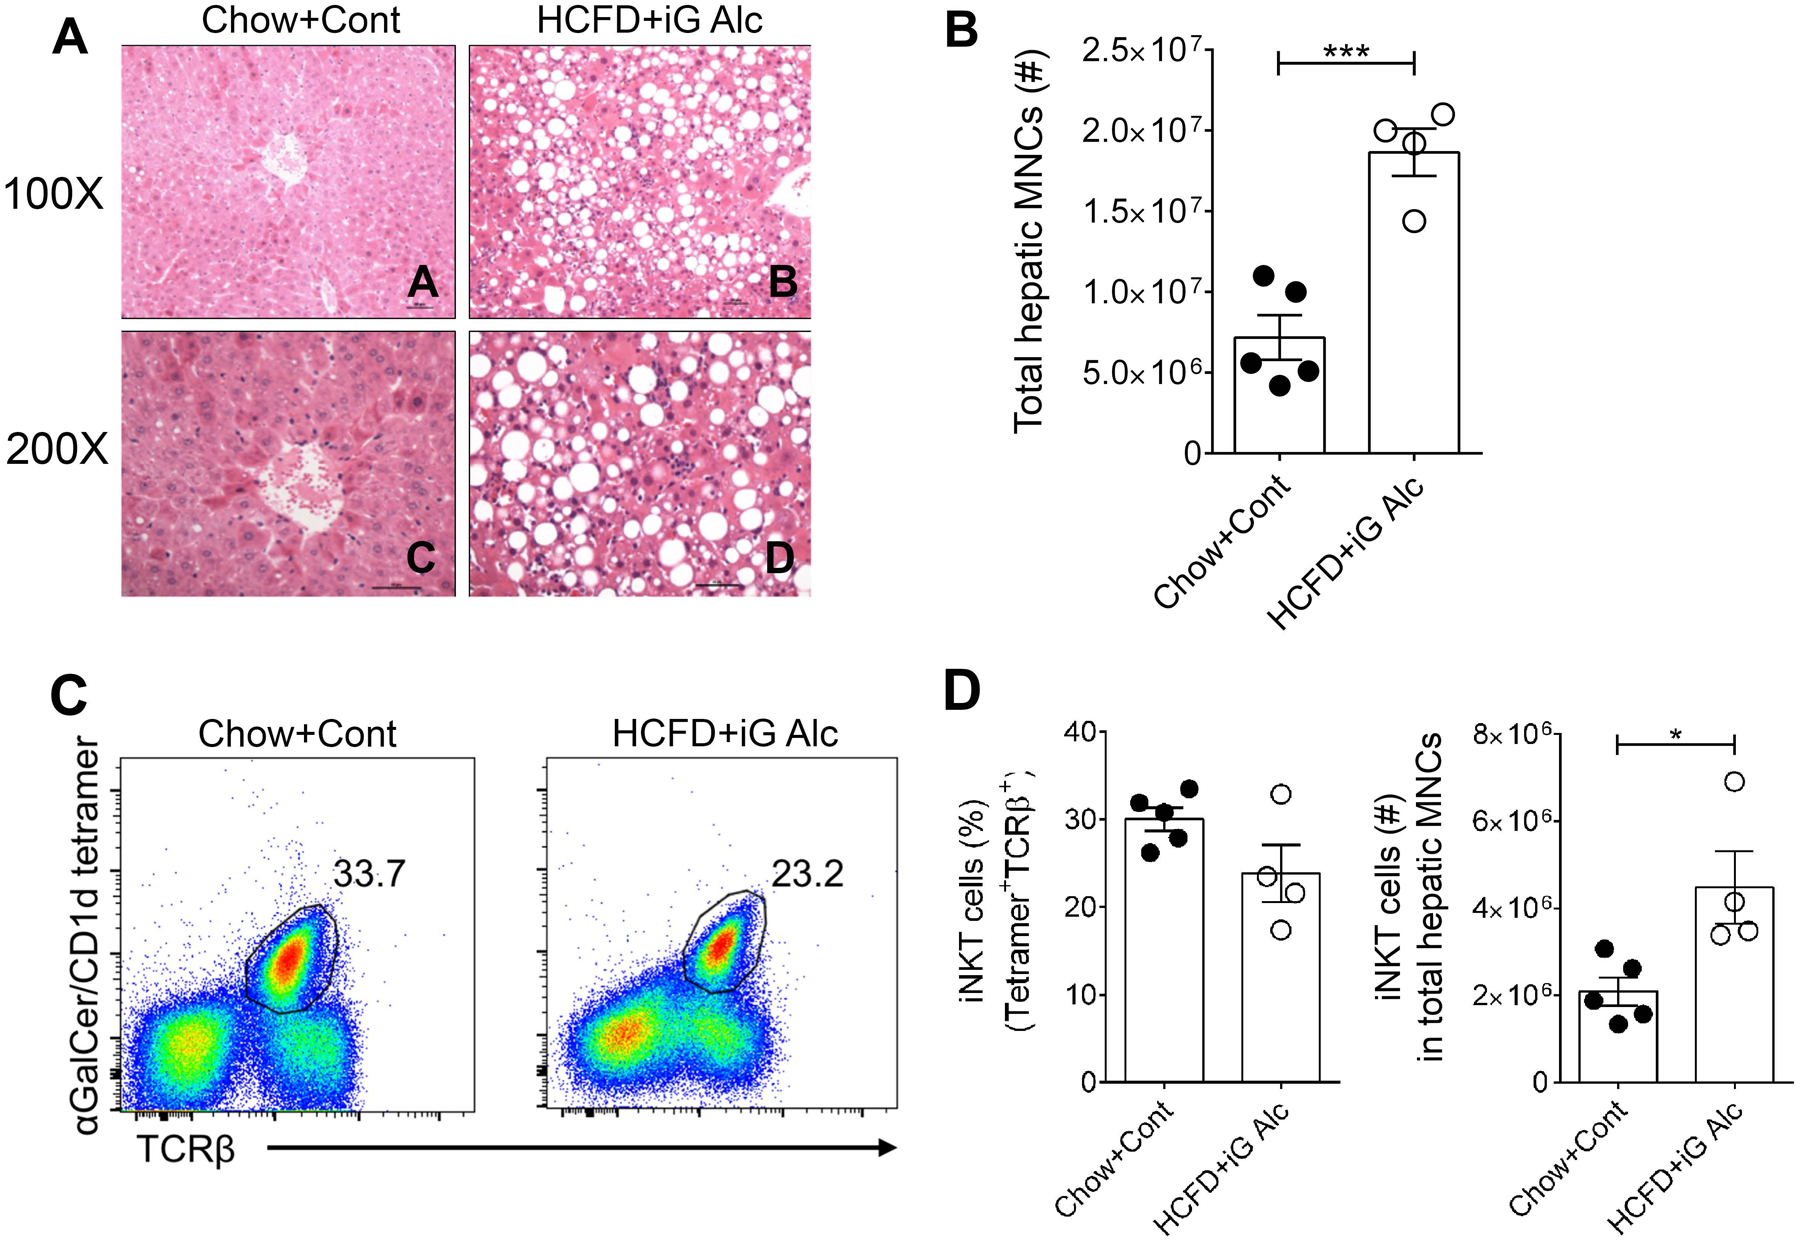
Figure 1. Hepatic iNKT cells in an intragastric model of chronic ASH.

(A) H&E stained liver sections from a mouse subjected to hybrid feeding of High-Cholesterol/High-Fat Diet (HFCD) ad lib and iG control diet (Chow+Cont) (Panels A, C) or HFCD ad lib and iG ethanol diet (HCFD+iG Alc) (Panels B, D). (B) Summary data of the total number of hepatic MNCs in HCFD+iG Alc- (n= 4) and Chow+Cont-fed (n= 5) B6 mice. ***p≤ 0.001, unpaired t test. (C) Representative dot plots of iNKT cells (αGalCer-Tetramer+TCRβ+) in liver lymphocytes from mice in Fig. 1B. Numbers on dot plots indicate the percentage of iNKT cells within the lymphocyte gate. (D) Summary data of the percentage (left) and numbers (right) of iNKT cells from mice in Fig. 1B. The numbers of iNKT cells were calculated using the percentages obtained from the total hepatic MNCs. *p≤ 0.05, unpaired t test. All data are presented as mean ± SEM and are representative of two iG-feeding experiments. iNKT, invariant Natural Killer T cells; iG, intragastric; ASH, alcoholic steatohepatitis; HCFD, High-Cholesterol /High-Fat Diet; MNCs, Mononuclear cells.
