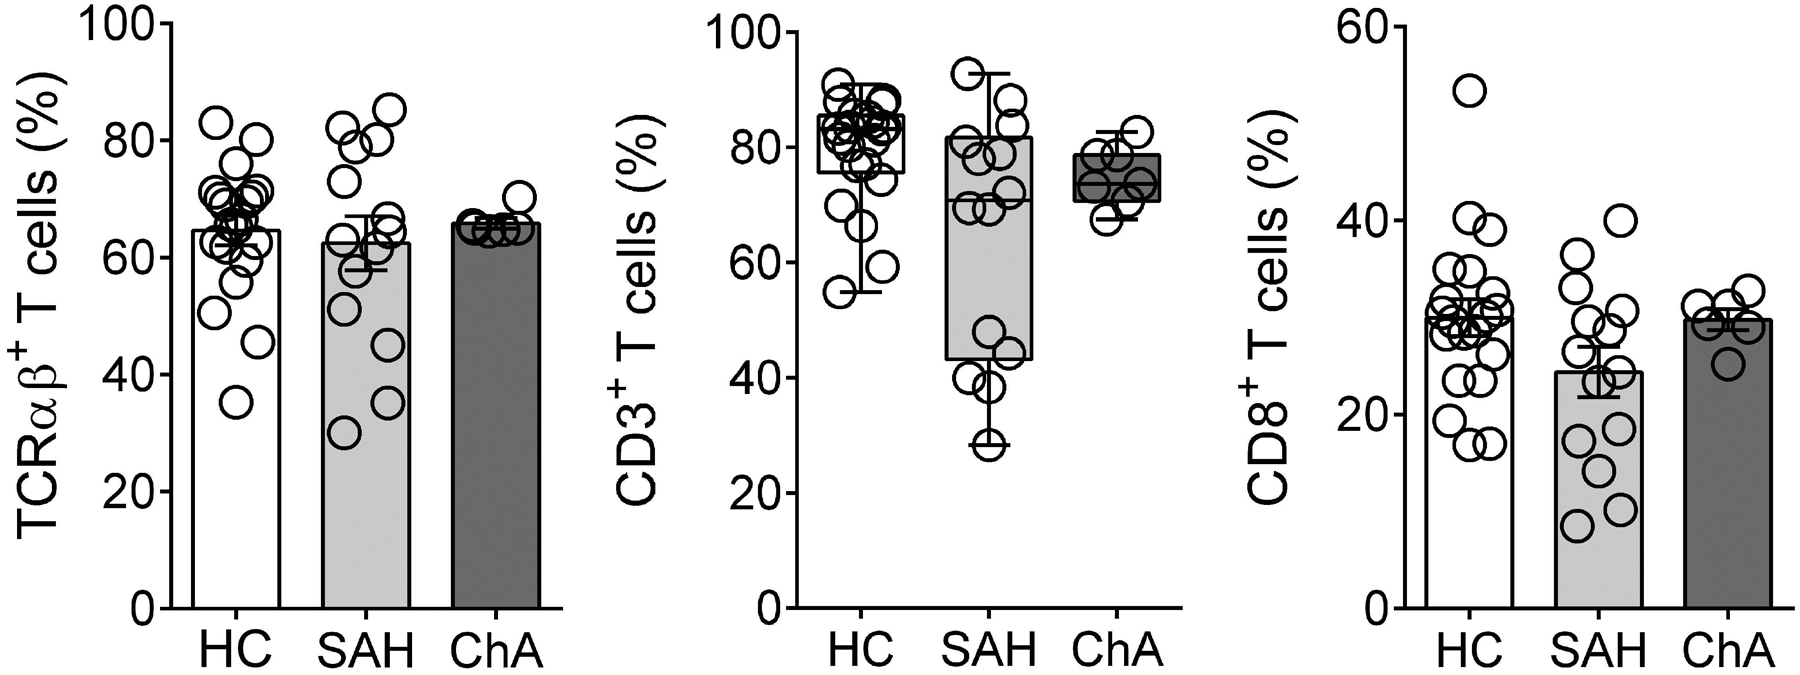
Figure 3. No changes in T-cell subsets in PBMC.

Summary data of percentage of TCRαβ+, CD3+ and CD8+ T cells in PBMC from SAH (n= 14) and ChA (n= 7) patients compared with HC (n= 22). All data are presented as mean ± SEM. PBMC, peripheral blood mononuclear cells; HC, healthy controls; SAH, severe alcoholic hepatitis; ChA, chronic alcoholics.
