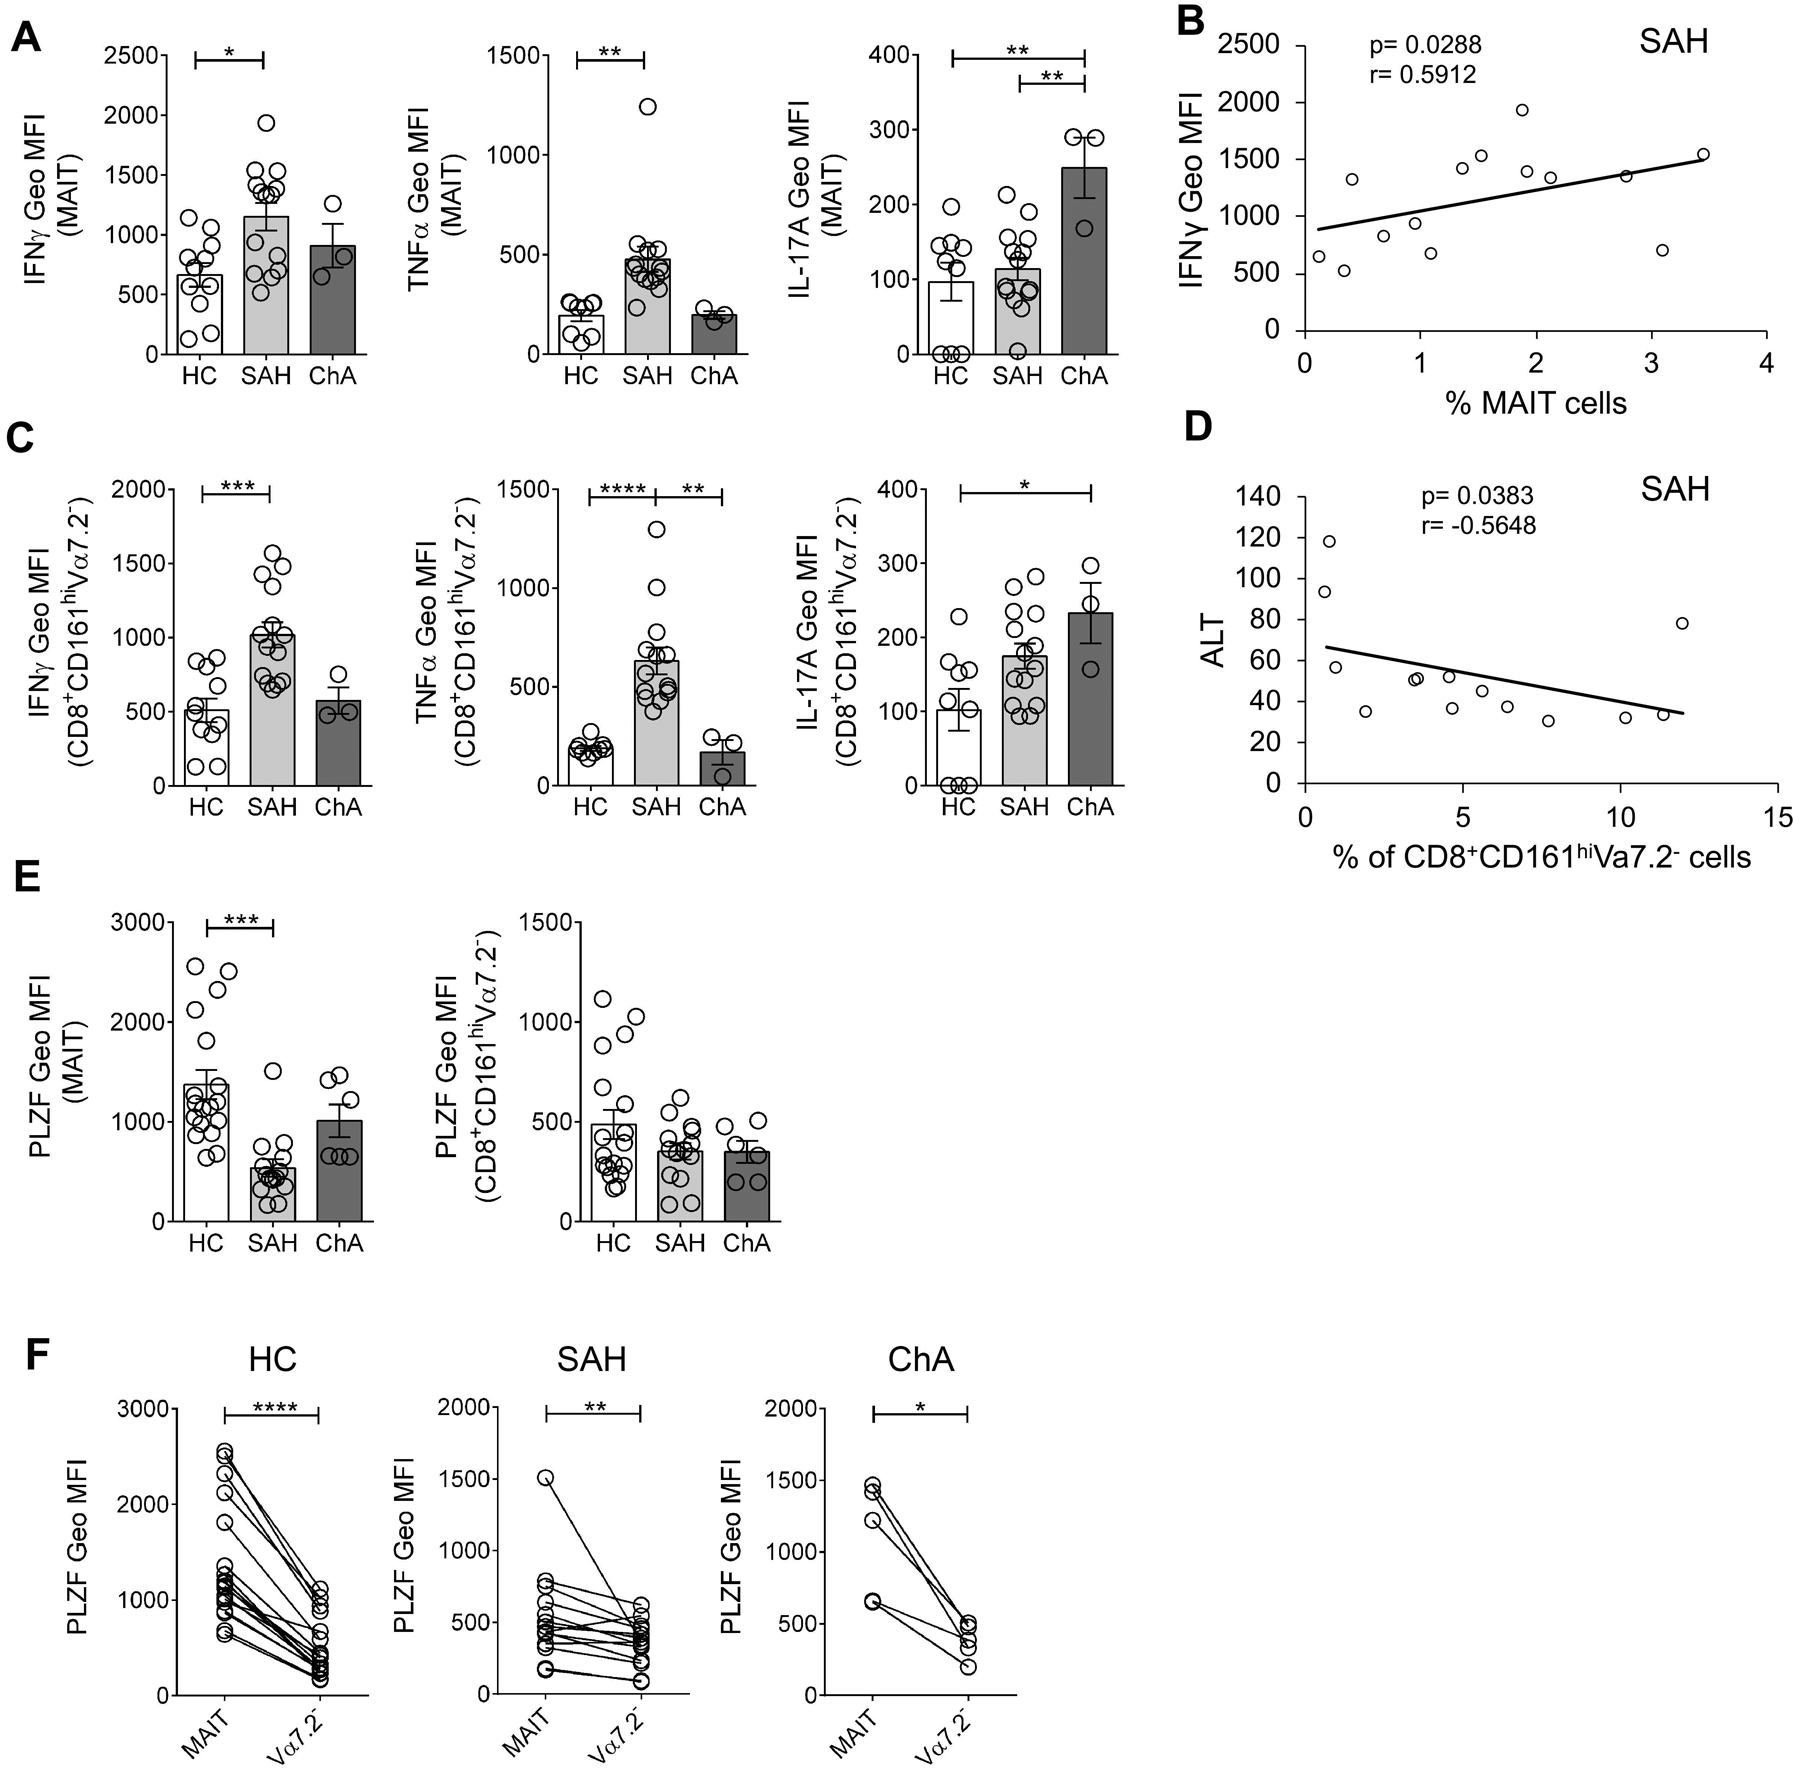
Figure 6. MAIT and CD8+CD161hiVα7.2− cells have different cytokine profile in SAH and ChA patients.

(A) IFNγ, TNFα and IL-17A production, expressed as Geo MFI values, by non-stimulated MAIT cells from SAH (n= 14) and ChA (n= 3) patients compared with HC (n= 9–11). *p≤ 0.05, **p≤ 0.01, One way ANOVA with Bonferroni’s multiple comparisons test. (B) Correlation between blood MAIT cells frequency and IFNγ production in SAH patients (Spearman correlation test). (C) IFNγ, TNFα and IL-17A production, expressed as Geo MFI values, by non-stimulated CD8+CD161hiVα7.2− cells from SAH (n= 14) and ChA (n= 3) patients compared with HC (n= 9–11). *p≤ 0.05, **p≤ 0.01, ***p≤ 0.001, ****p≤ 0.0001, One way ANOVA with Bonferroni’s multiple comparisons test. (D) Correlation between blood CD8+CD161hiVα7.2− cells frequency and ALT levels in SAH patients (Spearman correlation test). (E) PLZF expression, expressed as Geo MFI values, by MAIT cells (left) and CD8+CD161hiVα7.2− cells (right) in PBMC from SAH (n= 14) and ChA (n= 6) patients compared with HC (n= 18). ***p≤ 0.001, One way ANOVA with Bonferroni’s multiple comparisons test. (F) Comparison of PLZF expression between MAIT and CD8+CD161hiVα7.2− cells in PBMC from HC (n= 18), SAH (n= 14) and ChA (n= 6) patients. *p≤ 0.05, **p≤ 0.01, ****p≤ 0.0001, Wilcoxon matched-pairs signed rank test. All data are presented as mean ± SEM. MAIT, mucosa-associated invariant T cells; HC, healthy controls; SAH, severe alcoholic hepatitis; ChA, chronic alcoholics; ALT, alanine transaminase; PLZF, promyelocytic leukaemia zinc finger protein.
