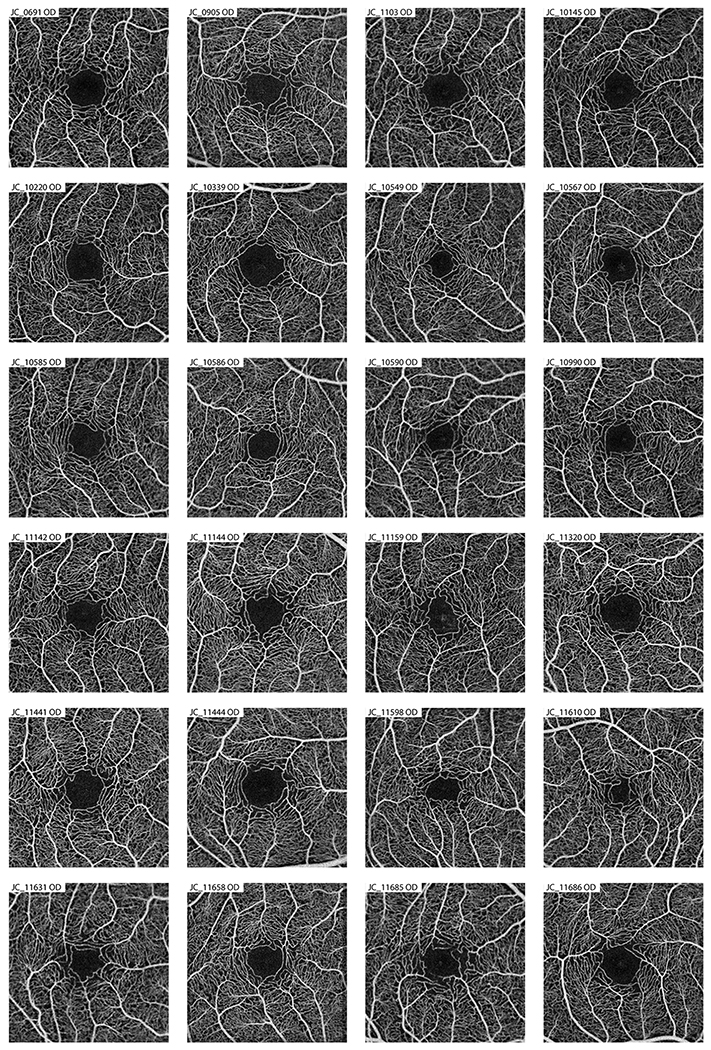
Figure 1.
Averaged OCT-A images of the contorl subjects used in the creation of the parafoveal intercapillary area normative database. Eyes within the control group were used as a comparison against the eyes with a “fragmented” FAZ to see if there were any difference in other foveal morphology measurements.

