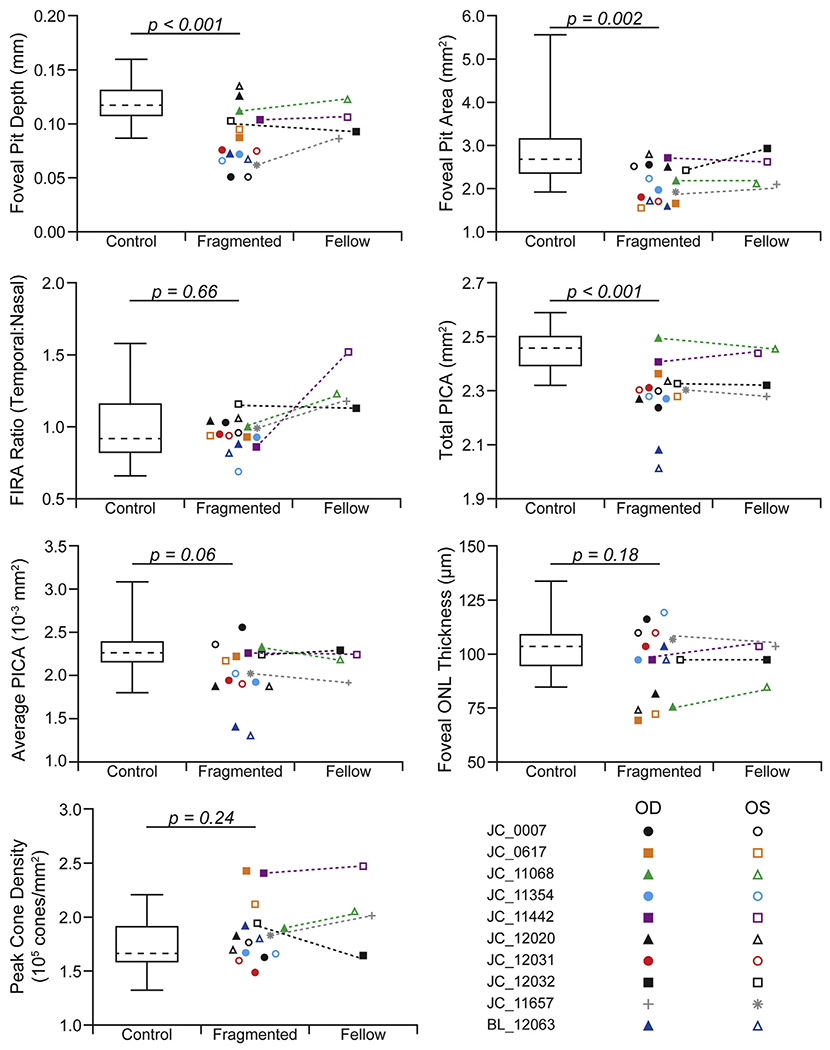
Figure 5.
Graphs comparing control eyes and eyes with a fragmented foveal avascular zone (FAZ). The control population is shown as a box-and-whisker plot (dashed line, mean; box limits, 25th—75th percentiles; whiskers, minimum and maximum). Each point within the fragmented and fellow eye group is a single eye (open, left eye [OS]; filled, right eye [OD]). Dotted lines connect the eyes in participants with unilateral fragmentation of the FAZ. Although the fellow eye is shown for comparison (when available), no statistical tests were performed between these groups. A significant difference was found between foveal pit depth, foveal pit area, and total PICA when comparing the controls with the fragmented eyes. FIRA = ■■■; ONL = outer nuclear layer.

