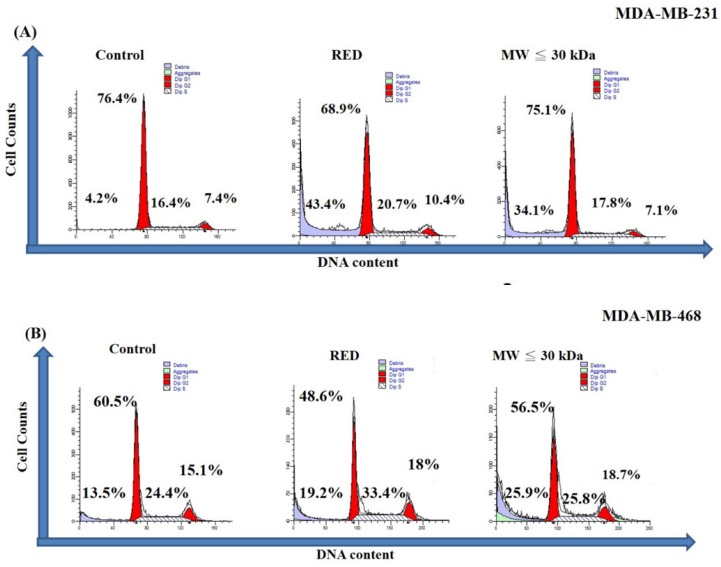
Figure 2.
Cell cycle analysis of TNBC cells treated with red guava extracts. (A) MDA-MB231 and (B) MDA-MB-468 cells were treated with no guava extract (control), 10% total extract (RED) or 10% LMW extract (MW ≤ 30kDa). The cells were fixed with ethanol and stained with PI. The cell cycle after extract exposure for 72 h was analyzed by flow cytometry.

