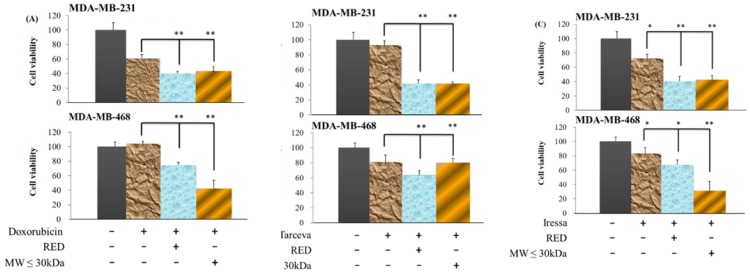
Figure 5.
Cell viability of TNBC cells treated with guava extracts plus clinical anti-cancer drugs. (A) Cells were treated with 0 nM doxorubicin (Control; column 1), 17 nM doxorubicin (column 2), 17 nM doxorubicin plus 10% total extracts (RED; column 3) or 17 nM doxorubicin plus 10% LMW extracts (MW ≤ 30kDa; column 4). (B) Cells were treated with 0 μM tarceva (column 1), 1 μM tarceva (column 2), 1 μM tarceva plus 10% total extracts (column 3) or 1 μM tarceva plus 10% LMW extracts (column 4). (C) Cells were treated with 0 μM iressa (column 1), 1 μM iressa (column 2), 1 μM iressa plus 10% total extracts (column 3) or 1 μM iressa plus 10% LMW extracts (column 4). The 72-h cell viability was measured by the MTT method. Values are expressed as the mean ± standard deviation from three independent experiments. *P < 0.05, **P < 0.01.

