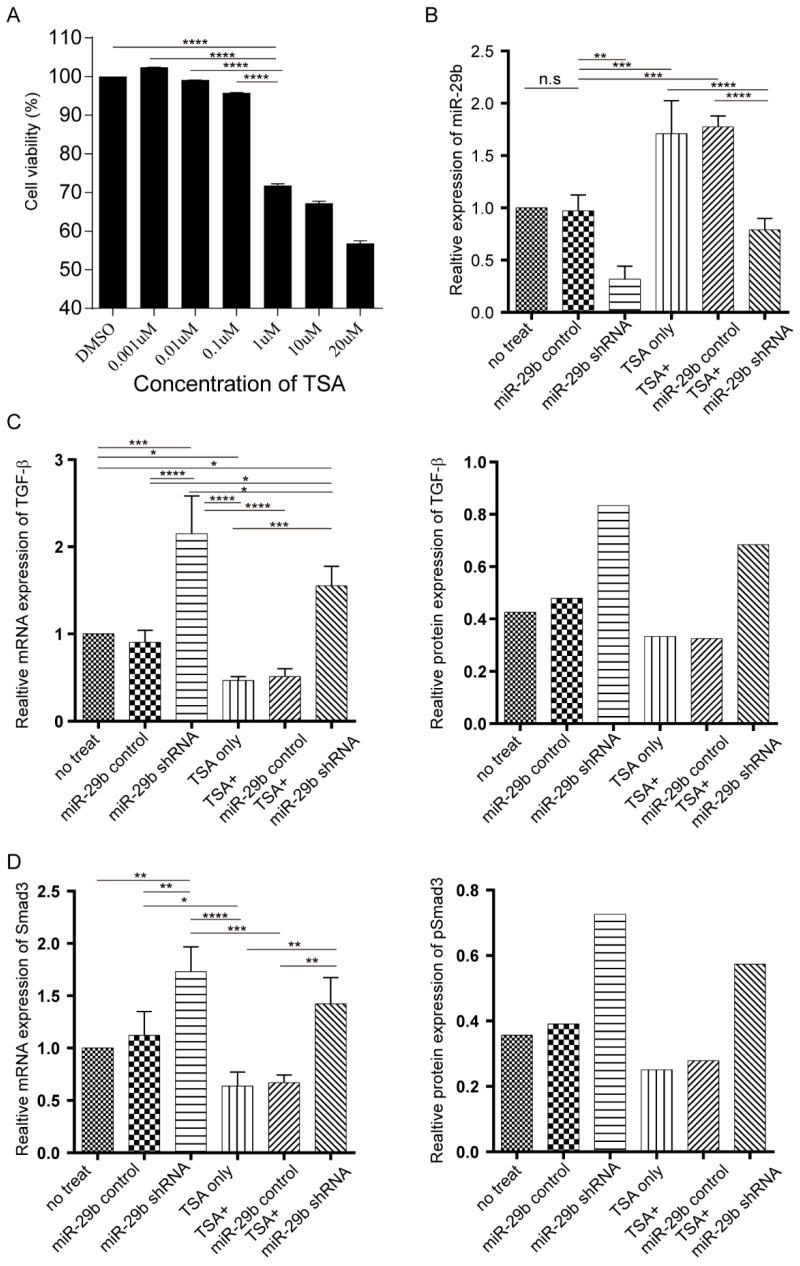
Figure 1.
The dynamic changes of miR-29b, TGF-β, and Smad under miR-29b inhibitor and TSA treatment. A: the cytotoxicity of TSA was determined by MTT assay. B: miR-29 expression was measured by qPCR. C: both mRNA and protein expression level of TGF-β were measured under different conditions. D: the Smad mRNA expression was measured by qPCR (n=3) and protein expression level (n=1) were measured by western blotting under different conditions., p-value *<0.05, **<0.01, ***<0.005, ****<0.001

