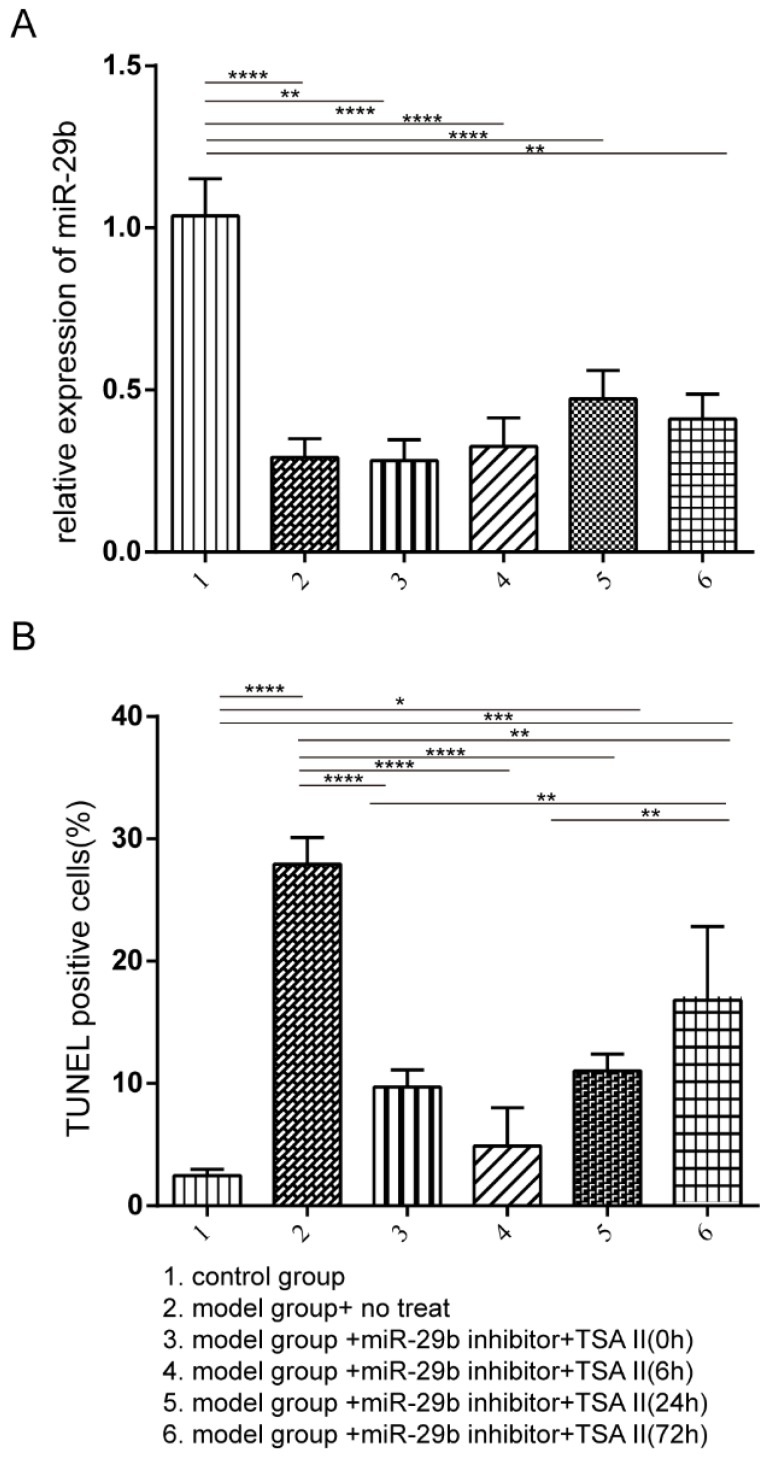
Figure 3.
The rat model was established and treated with the different condition as described from Group 1 to 6. The rat was then sacrificed after three-week after treatment. A: the miR-29b expression was quantified by qPCR, and the result was normalized to the control group. B: TUNEL assay was performed to investigate the frequency of apoptotic cells. n=3, p-value *<0.05, **<0.01, ***<0.005, ****<0.001

