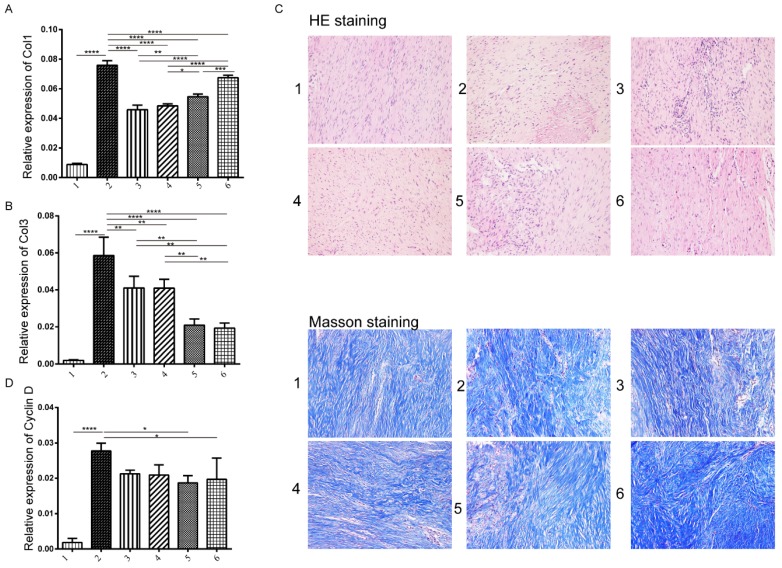
Figure 5.
Analysis of tendon tissue on collagen expression and histology changes. The collagen I expression level was measured by immunohistochemistry in each group at three weeks. A: the production of collagen I in different groups B: the production of collagen III, C: Hematoxylin & Eosin (H&E) staining (upper panel) and Masson staining (lower panel) on tendon tissue of rats in various groups (×200). D: the expression of cyclin D: histological evaluation of tendon tissue at weeks 3 in each group. n=3, p-value *<0.05, **<0.01, ***<0.005, ****<0.001

