Figure 1.
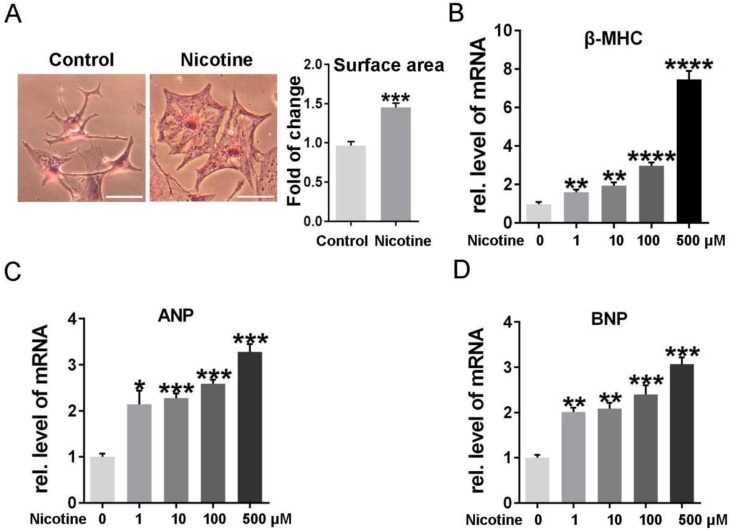
Different concentrations of nicotine treatment caused cardiomyocytes hypertrophy significantly. (A) HE staining was performed to detect the cell area after stimulation with nicotine, and quantification was analyzed by Image J software. (Scale bar = 20μm) qPCR was performed to determine the cardiac hypertrophy markers, (B) β-MHC, (C) ANP and (D) BNP. (****, p < 0.0001; ***, p < 0.001; **, p < 0.01; *, p < 0.05, n = 3).

