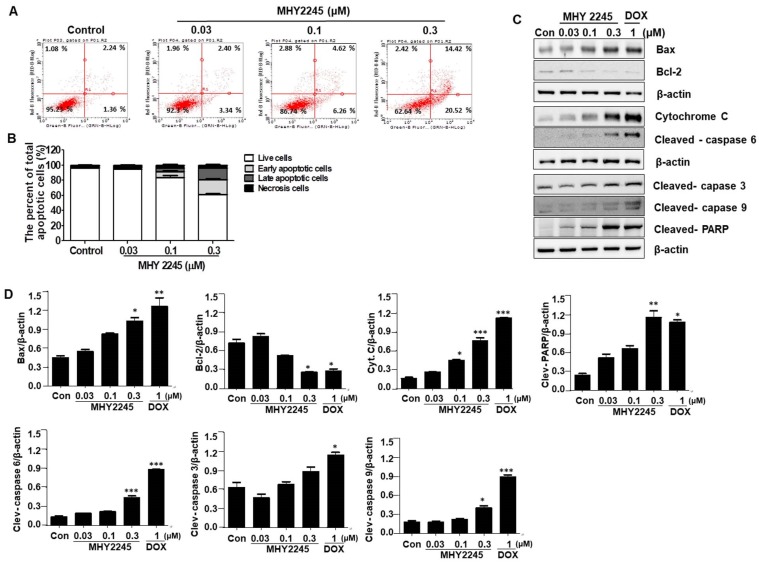
Figure 4.
Effect of MHY2245 on apoptotic cell death pathways in SKOV3 cells. (A) Cells were treated with vehicle control, MHY2245, or doxorubicin (DOX) for 48 h. The flow cytometry profile represents AnnexinV-FITC staining on the x axis and PI staining on the y axis. (B) Bar graph showing the percentage of apoptotic cells. Data are expressed as mean ± SD of three experiments. (C) Cells were treated with vehicle control, MHY2245 (0.03, 0.1, or 0.3 µM) or DOX (1 µM) for 48 h and the expression of apoptosis-related proteins was analyzed by Western blot. β-Actin was used as a loading control. (D) Representative histogram showing the expression levels were quantified using Image J software compared to β-actin percentage in SKOV3 cells. Data are expressed as mean ± SD of triplicate experiments. *p < 0.05 and **p < 0.01 and ***p < 0.01versus the control group.

