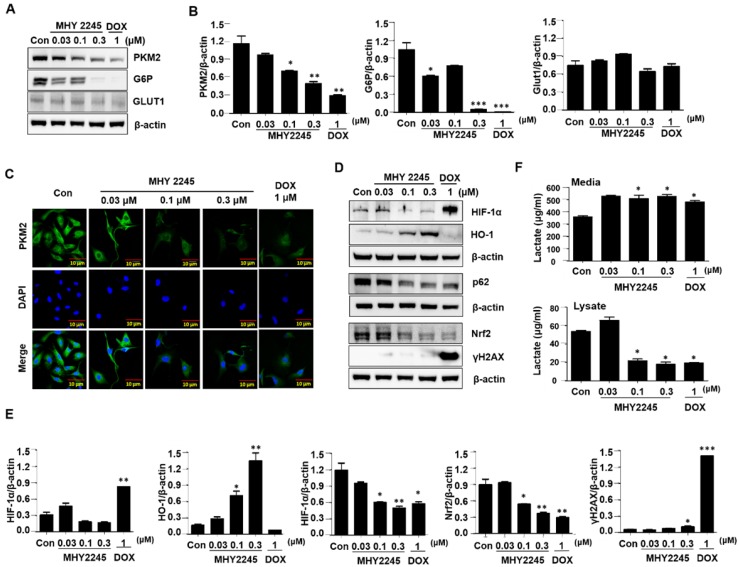
Figure 7.
Effect of MHY2245 on energy metabolism in SKOV3 cells. (A) Cells were treated with vehicle control, MHY2245 (0.03, 0.1 or 0.3 µM) or doxorubicin (DOX; 1 µM) for 48 h and the expression of PKM2, G6P, and GLUT1 levels was analyzed by Western blot. β-Actin was used as a loading control. (B) A representative histogram showing the expression levels, which were quantified using Image J software compared to β-actin. Data expressed as mean ± SD of triplicate experiments. *p < 0.05 and **p < 0.01 and ***p < 0.01 versus the control group. (C) Cells were treated with vehicle control, MHY2245 (0.03, 0.1 or 0.3 µM), or DOX (1 µM) for 48 h andPKM2 levels (Green) were determined by immunofluorescent staining. The nuclei (blue) were stained with DAPI. Immunofluorescence images were taken with a 50× magnification. Scale bar, 10 µm. (D) Cells were treated with vehicle control, MHY2245 (0.03, 0.1 or 0.3 µM) or DOX (1 µM) for 48 h and the expression of HIF-1α, HO-1, p62, Nrf-2, and yH2AX levels was analyzed by Western blot. β-Actin was used as a loading control. (E) A representative histogram showing the expression levels, which were quantified using Image J software compared to β-actin percentage. Data are expressed as mean ± SD of triplicate experiments. *p < 0.05 and **p < 0.01 and ***p < 0.01 versus the control group. (F) Effects of lactate production by MHY2245 or DOX in SKOV3 cells. Cells were treated with vehicle control, MHY2245 (0.03, 0.1 or 0.3 µM) or DOX (1 µM) for 48 h and lactate concentration of the cellular or media were analyzed according to described in Materials and Methods. Results are expressed as mean ± SD of triplicate experiments. *p < 0.05 versus the control group.

