Figure 6.
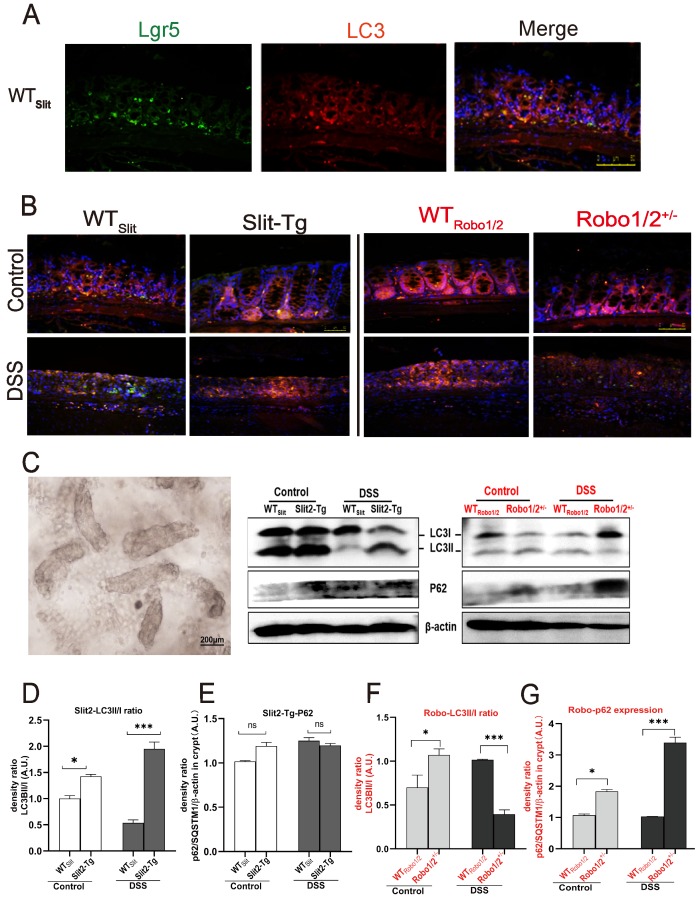
Expression of the autophagy proteins in DSS-induced mice. The coexpression of Lgr5+ colonic stem cells and the autophagy protein LC3 in (A) WTSlit and Slit2-Tg mice and (B) WTRobo1/2 and Robo1/2+/- mice. Lgr5 (green) and LC3 (red) expression in the colonic epithelium. Sections were counterstained with DAPI (blue). (n=5 in each group; scale bar = 50 μm); (C) the photograph of the crypt isolated from colon tissue (scale bar= 200μm); (D) protein expression of LC3II/I in (D) WTSlit and Slit2-Tg mice and (F) WTRobo1/2 and Robo1/2 +/- mice (n=4); The expression of P62 in (E) WTSlit and Slit2-Tg mice and (G) WTRobo1/2 and Robo1/2+/- mice (n=3-4 in each group). Detection of β-actin served as a loading control. Quantification of bands is expressed as density ratio of indicated protein/β-actin (A.U.); data are present as means ± SEM. *P<0.05, **P<0.01, ***P<0.001.

