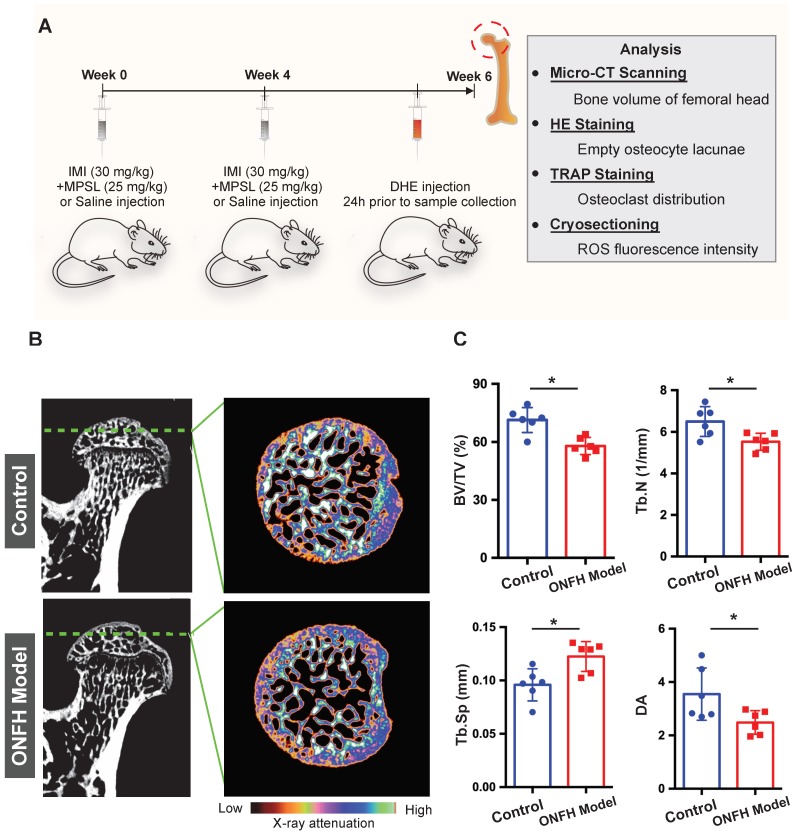
Figure 3.
Steroid-induced osteonecrosis of femoral head (ONFH) of rat and micro-CT (μCT) analysis. (A) Schematic illustration of the establishment of rat ONFH model. (B) Representative μCT scanning images of the femoral head of the control group and model group. (C) Quantification of the bone microstructure parameters of the femoral head, including bone volume/tissue volume (BV/TV), trabecular number (Tb.N), trabecular separation (Tb.Sp), degree of anisotropy (DA). All bar graphs are presented as mean ± SD (n=6 in each group); *P<0.05 compared with the control group; ns, no significance.

