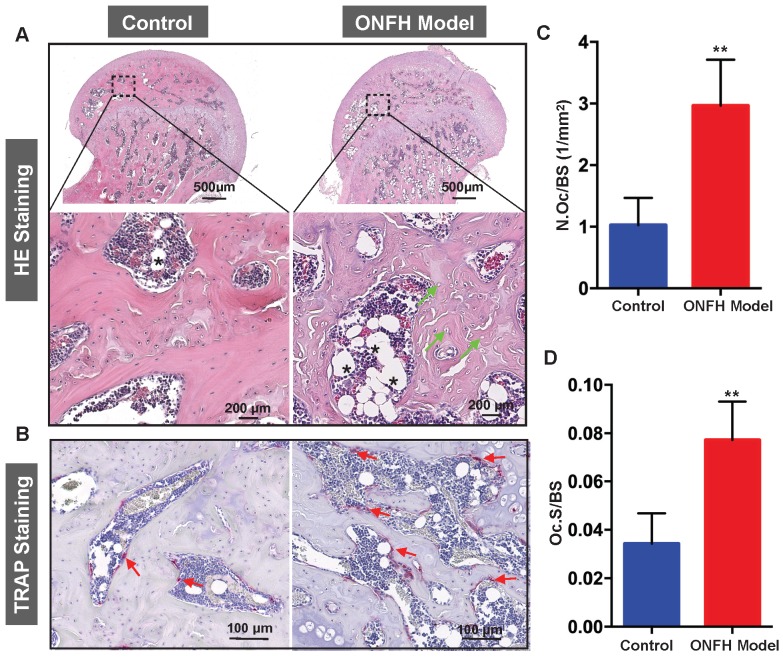
Figure 4.
Histomorphometric analysis of steroid-induced osteonecrosis of femoral head (ONFH) in rat model. (A) Hematoxylin & Eosin (HE) staining of decalcified paraffin-embedding sections showing the increased number of empty lacunae (green arrows) and adipose tissue area (asterisk) in the model group. (B) Tartrate-resistant acid phosphatase (TRAP) staining showing the osteoclasts (red arrows) in the control and model groups. (C and D) Quantitative analyses of N.OC/BS and Oc.S/BS (N=5 per group). **P<0.01 compared with control group. N.Oc/BS, osteoclast number/bone surface; Oc.S/BS, osteoclast surface/bone surface.

