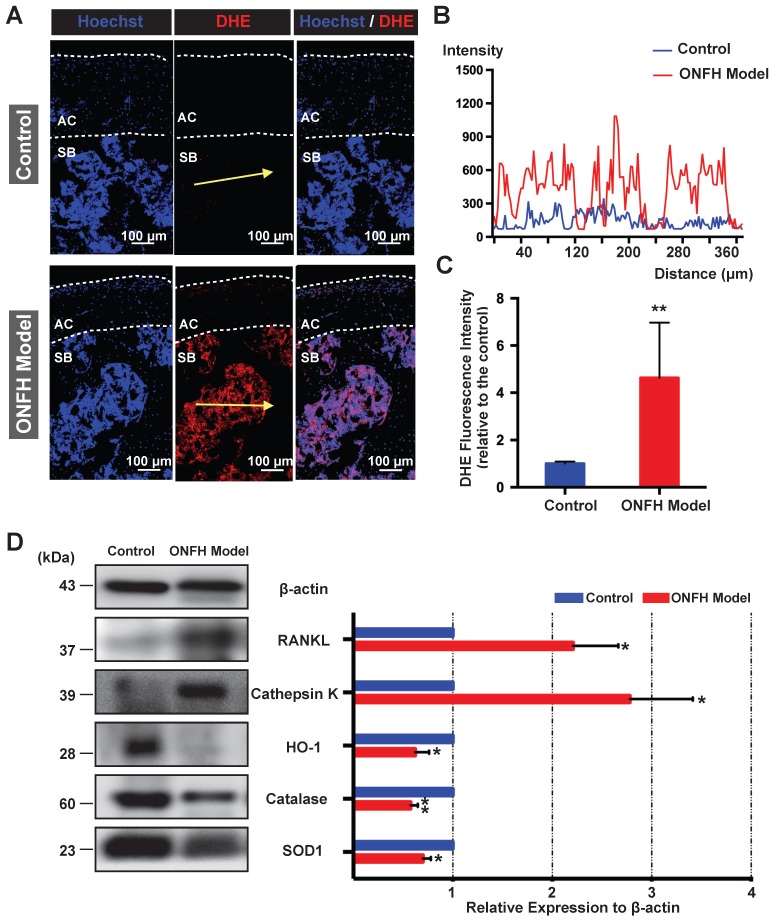
Figure 5.
Analysis of reactive oxygen species (ROS) level and antioxidant enzymes in the rat femoral head. (A) Cryosections of femoral heads showing ROS level, as probed by dihydroethidium (DHE), in the control group and model group. AC, articular cartilage (white dashed line area); SB, subchondral bone. (B) DHE fluorescence intensity profile through subchondral area of femoral head (indicated by the yellow arrow in A) The abscissa of the DHE intensity profile represents the distance from the “start point” of the yellow arrow. (C) Quantification of DHE fluorescence intensity relative to the control group (n=5 in each group). (D) Western blot analysis of the protein expression level of osteoclast-related markers including RANKL and cathepsin K, as well as anti-oxidant enzymes including heme oxygenase 1 (HO1), catalase, and superoxide dismutase 1 (SOD1) (n=3 in each group). All bar graphs are presented as mean ± SD. *P<0.05, **P<0.01 compared with control group.

