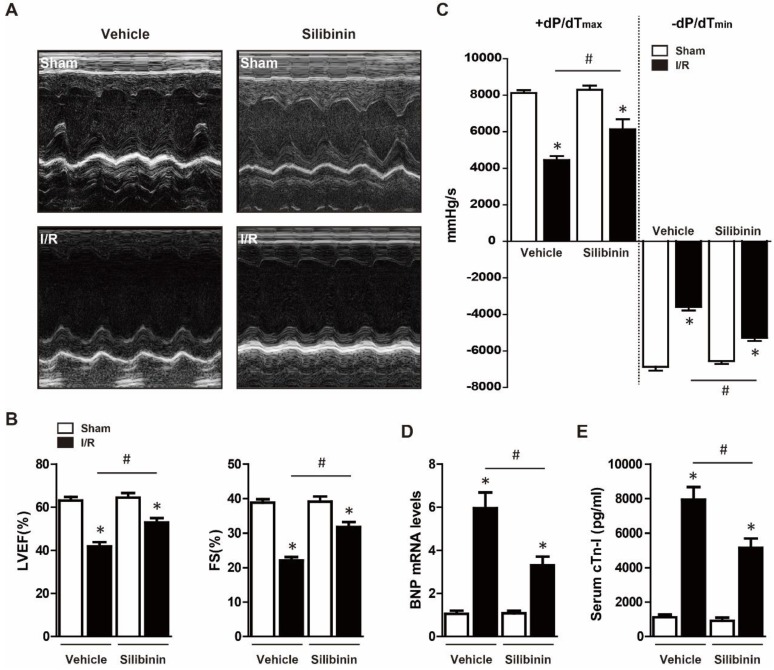
Figure 1.
Effect of silibinin on I/R-induced cardiac dysfunction. A, Representative images of M-mode echocardiograms obtained at baseline and 24 hours after I/R. B, Quantitative analysis of LVEF, FS through echocardiography (n=6 for each). C, Hemodynamic analysis of +dP/dTmax and -dP/dTmin (n=6 for each). D, BNP transcription levels determined by real-time PCR (n=6 for each). E, Measurement of serum cTn-I level at 24 hours after I/R (n=6 for each).*p<0.05 vs. Sham+vehicle. #p<0.05 vs. I/R+vehicle.

