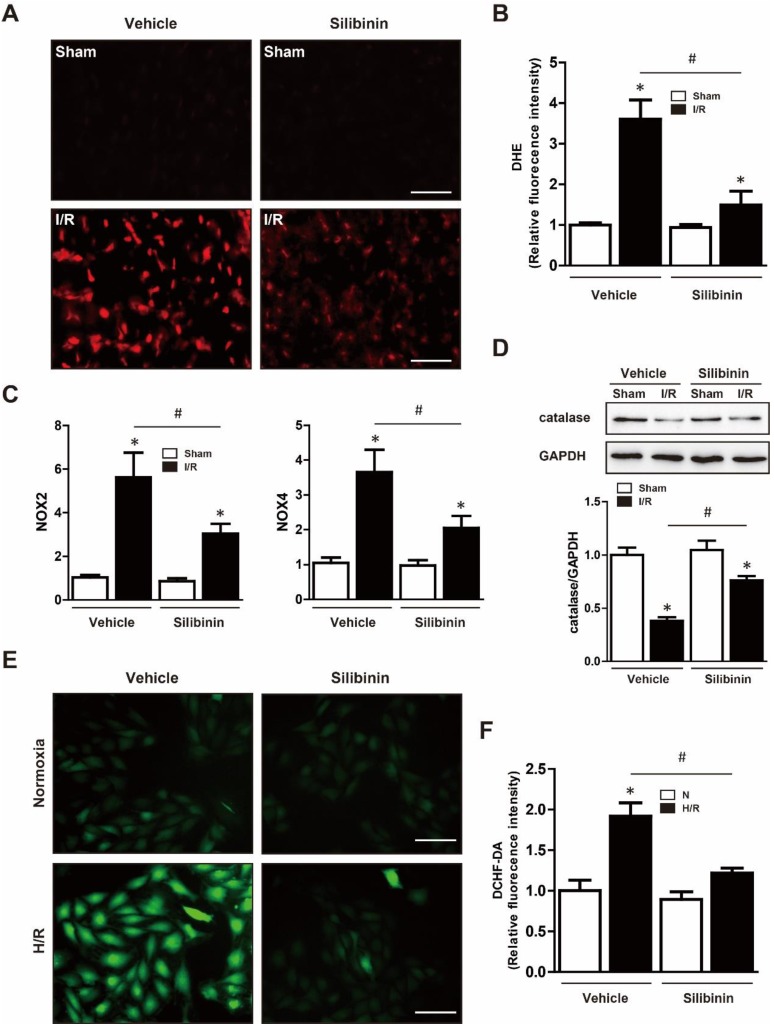
Figure 7.
Silibinin treatment alleviates I/R-induced oxidative stress. A, Representative images of the DHE staining in the infarct border zone. B, Fluorescence intensity of DHE measured in the infarct border zone at 24 hours after I/R (n=6 for each). C, NOX2 and NOX4 transcription levels determined by real-time PCR (n=6 for each). D, Representative WB and quantitative analysis of catalase in reperfused myocardium (n=6 for each). Bar=50 μm. *p< 0.05 vs. Sham+vehicle. #p< 0.05 vs. I/R+vehicle. E, Representative images of DCHF-DA staining in H9C2 cells. F, Fluorescence intensity of DCHF-DA measured in H9C2 cells exposed to H/R (n=4 for each). Bar=50 μm. *p<0.05 vs. Sham+vehicle. #p<0.05 vs. H/R+vehicle. H/R, hypoxia/reperfusion.

