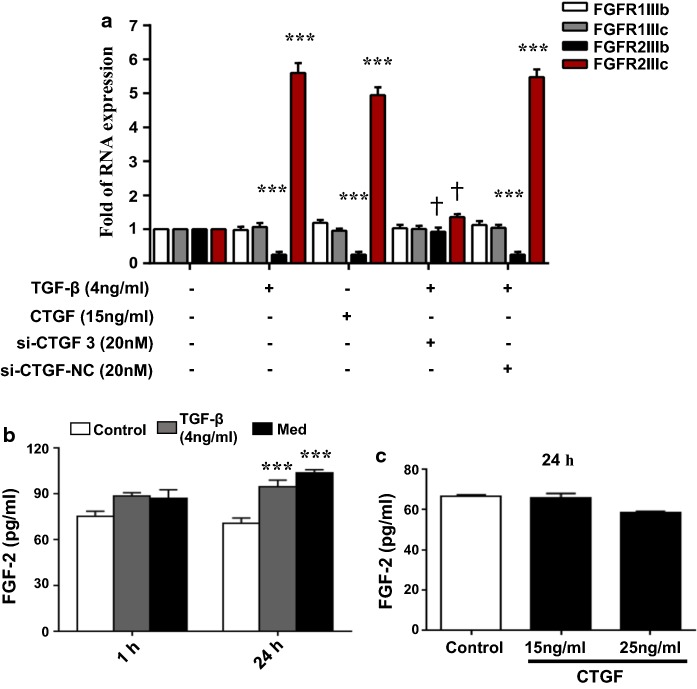
Fig. 2.
The levels of FGF receptor subtypes in AE2 cells in the presence of CTGF, and levels of FGF-2 in AE2 cells following stimulation with either TGF-β or Med. a Bar chart summarising the RT-PCR expression data for FGF receptor subtypes (FGF1IIIb, FGF1IIIc, FGF2IIIb, and FGF2IIIc) in AE2 cells following stimulation with 4 ng/ml TGF-β, 20 nM siRNA-CTGF or 15 ng/ml CTGF for 24 h. b ELISA results showing FGF-2 levels in AE2 cells after 1 h and 24 h stimulation with either 4 ng/ml TGF-β or 100% Med. c ELISA results showing FGF-2 levels in AE2 cells at 24 h after stimulation with either 15 ng/ml CTGF or 25 ng/ml CTGF. *Indicates comparison with the control; † indicates comparison with the induced groups (***,†p < 0.001)

