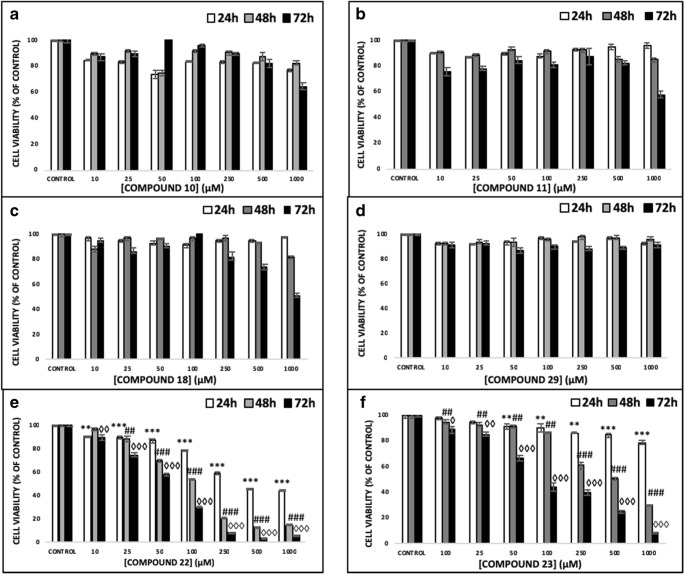
Fig. 2.
The ability of hydroxypyridones to induce cytotoxicity in A375 cells. Cells were exposed to a range of 10–1000 μM concentrations of (a) compound 10, (b) compound 11, (c) compound 13, (d) compound 29, (e) compound 22 and (f) compound 23 for 24, 48 and 72 h. Data shown are means ± SD of 5 replicates from three independent experiments. Asterisk (*), hashtag (#) or rhombus (◊) denote statistical significance when compared to their respective controls at p < 0.05. **, ## and ◊◊ denote statistical significance at p < 0.01 whereas ***, ###, ◊◊◊ at p < 0.001

