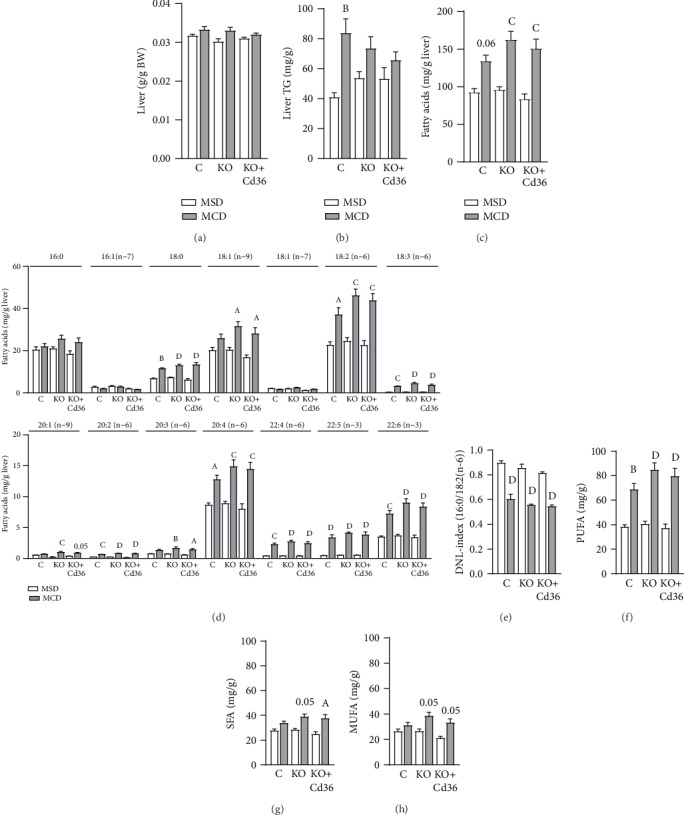
Figure 2.

MCD diet increased hepatic polyunsaturated fatty acids independently of hepatocyte PPARγ and CD36 expression. (a) Relative liver weight. (b) Hepatic triglycerides (Liv TG) levels. Hepatic levels of (c) total fatty acid levels, (d) individual subspecies of fatty acid methyl esters, (e) de novo lipogenesis (DNL: 16/18 : 2 (n‐6)) index, (f) saturated fatty acids (SFA), (g) monounsaturated fatty acids (MUFA), and (h) polyunsaturated fatty acids (PUFA). Values are represented as the mean ± standard error of the mean. Letters represent significant differences between MSD and MCD within the group. Ap < 0.05; Bp < 0.01; Cp < 0.001; Dp < 0.0001. Control mice (C); PpargΔHep mice (KO); PpargΔHep mice with hepatocyte Cd36 overexpression (KO+Cd36). MSD diet: open columns; MCD diet: close columns. n = 5‐6 mice/group.
