Figure 3.

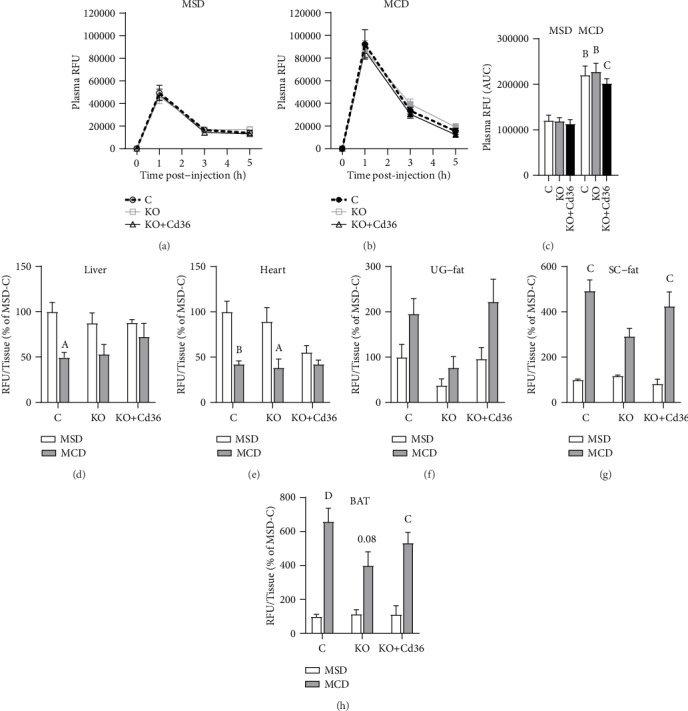
MCD diet reduced hepatic fatty acid uptake but increased fatty acid uptake in adipose tissue. Plasma BODIPY-C16 levels in mice fed (a) MSD diet or (b) MCD diet. (c) Area under the curve of plasma BODIPY-C16 levels. (d) Liver-, (e) heart-, (f) urogenital (UG) fat-, (g) subcutaneous (SC) fat-, and (h) brown adipose tissue- (BAT-) specific uptake of BODIPY-C16. RFU: relative fluorescence units. Values of RFU/tissue are represented as the percentage of control mice fed a MSD diet (e–h). Letters represent significant differences between MSD and MCD within groups. Ap < 0.05; Bp < 0.01; Cp < 0.001; Dp < 0.0001. Control mice (C); PpargΔHep mice (KO); PpargΔHep mice with hepatocyte Cd36 overexpression (KO+Cd36). MSD diet: open columns, open symbols; MCD diet: close columns, close symbols. In (a–c), control mice (open columns, discontinuous lines), KO mice (grey lines and columns), and KO+Cd36 mice (black lines and columns). n = 4‐7 mice/group.
