
Fig.1.
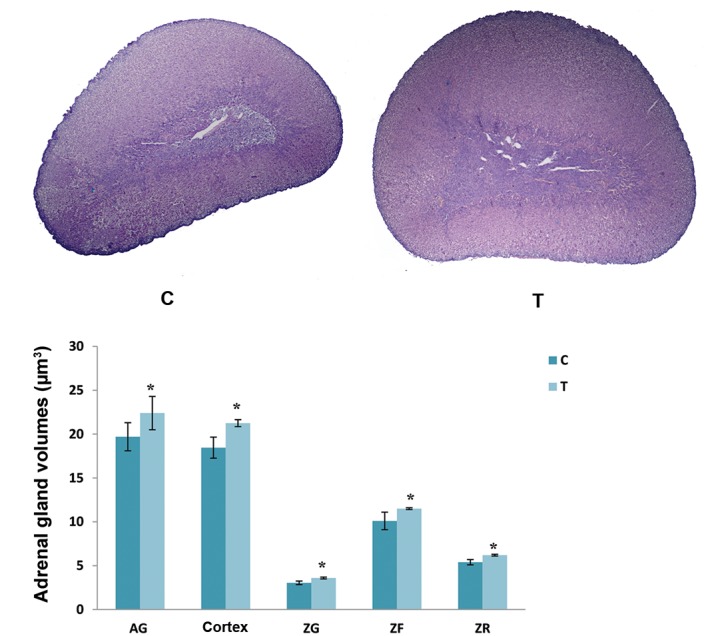
Histological appearance and volumes of the adrenal gland (AG), AG cortex and individual zones within the cortex [zona glomerulosa (ZG), zona fasciculate (ZF) and zona reticularis (ZR)] in the control group (C) and after exposure to the elevated temperature for four days (T). Results are expressed as the mean ± SD. *; P<0.05 vs. control (scale bar: 400 µm).