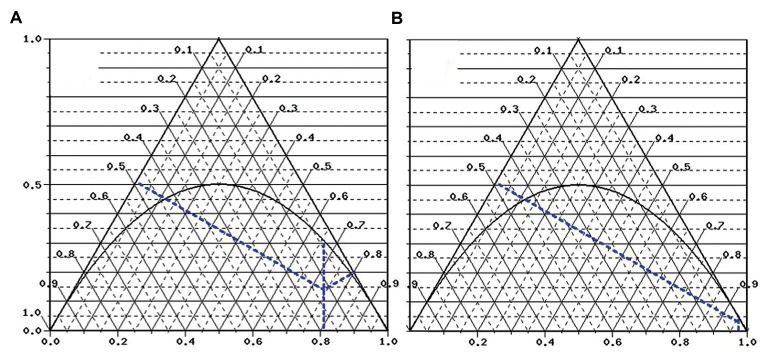
Fig.1.
De Finetti representation of Ermi؛ Karaali et al. (6) results of TLR2 -196 to -177 variant on T2DM risk. De Finetti representation (8) of A. Both cases and B. Controls from Ermi؛ Karaali et al. (6). The X-axis represents the frequency of the Ins allele. The intersection of the parabola and vertical line represents the frequency of genotype Ins/Del under f Hardy-Weinberg Equilibrium.

