Figure 1.

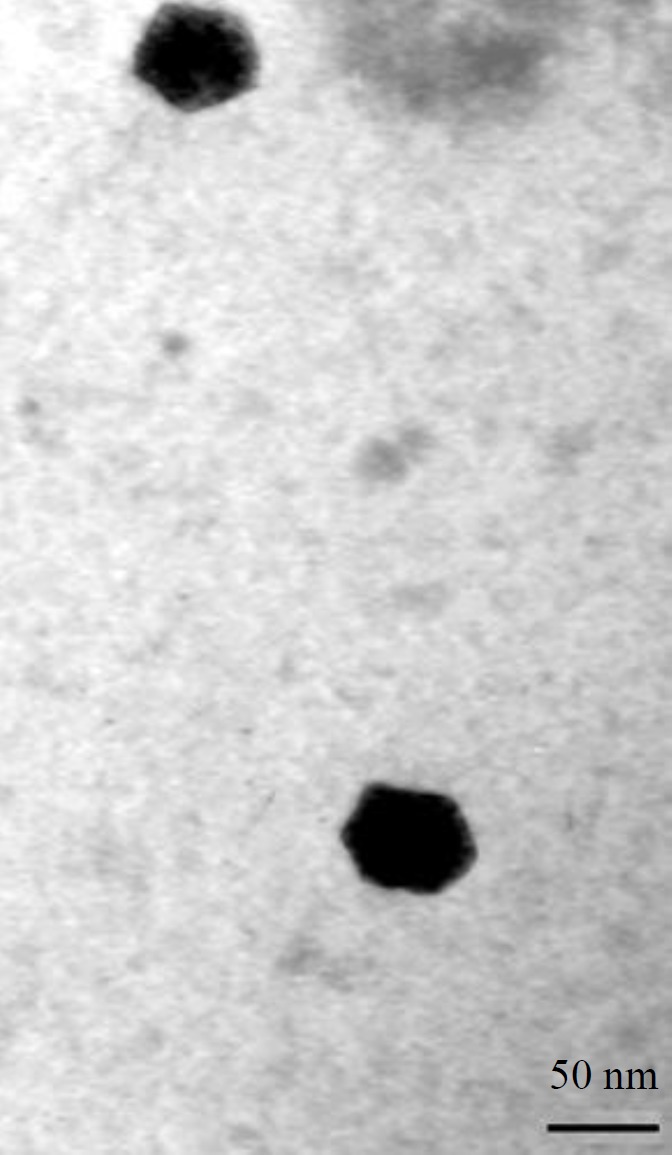
Electron micrograph of phage gT0E.co-MGY2 particles under a transmission electron microscope. Scale bar represents 50 nm

Electron micrograph of phage gT0E.co-MGY2 particles under a transmission electron microscope. Scale bar represents 50 nm