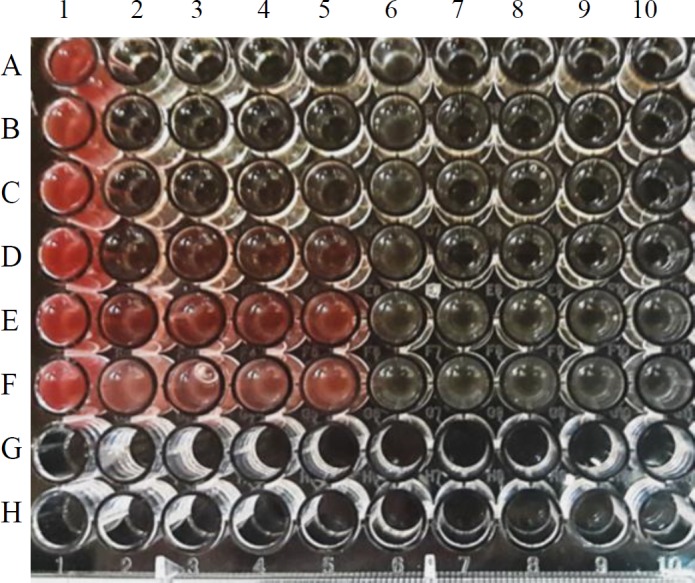
Figure 5.

Synergistic action of the phage and ampicillin in the microdilution assay. The image of the plate in the microdilution method, TTC reduction by live bacterial cells changed the color to red, which is correspondent to the bacterial growth. Column 1, rows A-F: Bacterial control (CFU 107) test repeats. Columns 2-5: Ampicillin-alone tests, rows A-F: ampicillin at concentrations of 50, 25, 12.5, 6.25, 3.125, and 1.562 µg/mL, respectively. Column 6, rows A-F: Phage-alone test repeats are. Columns 7-10, rows A-F: Phage-ampicillin combinations (including phage at MOI 10 and ampicillin at the same concentrations of column 2-5). The rows G-H are empty
