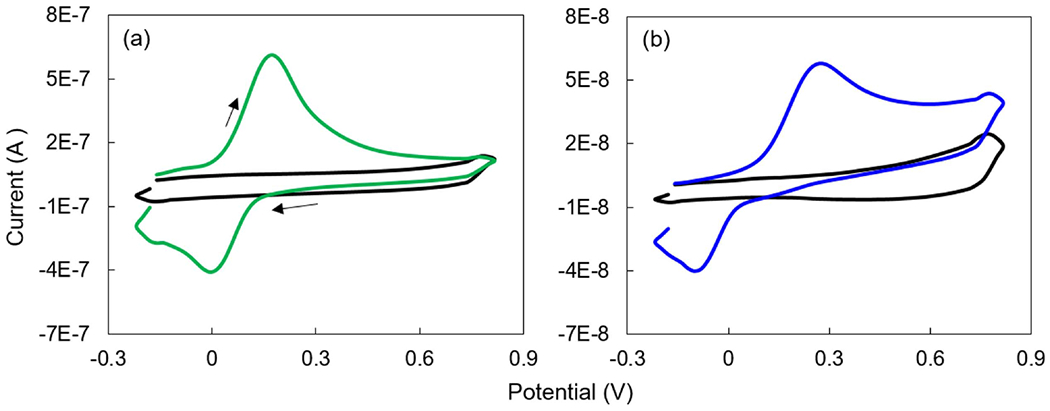
Figure 2.

Cyclic voltammograms of (a) CFM (green curve) and (b) 150 μm BDUNCD (blue curve) microelectrodes in 100 μM DA prepared in 1X PBS buffer solution. Background voltammograms (black curves) are taken in 1X PBS buffer. Scan rate is 10 V s−1. The arrows represent the scan direction, i.e. starting at −0.2 V and scanning forward to +0.8 V and back to −0.2 V.
