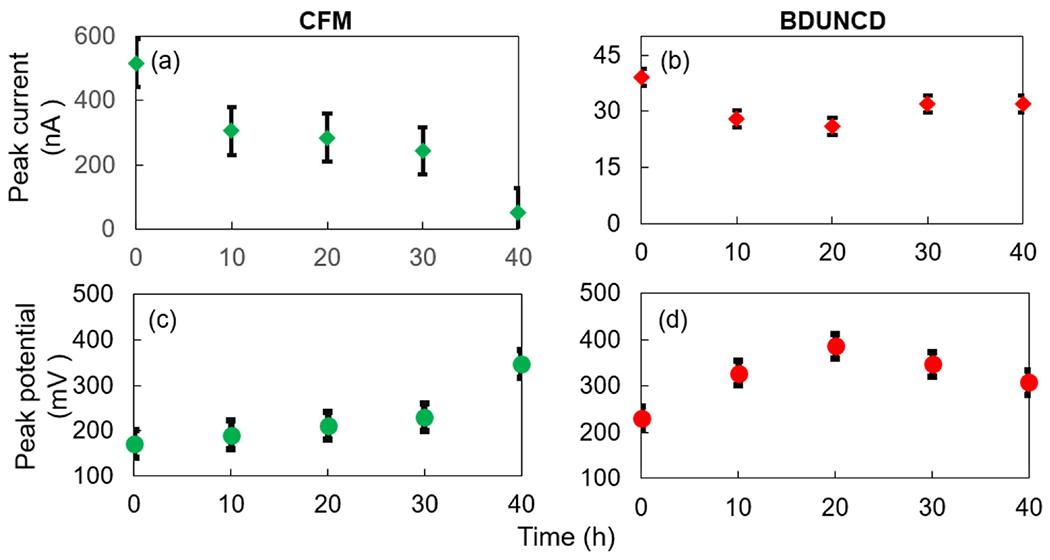
Figure 5.

The anodic peak current and potential values of CFM (a), (c) and BDUNCD (b), (d) microelectrodes in 100 μM DA, respectively at various cleaning times (0–40 h). Scan rate is 10 V s−1. T-test was performed with two different scan rate data for anodic peak current and peak voltage values with results p < 0.05 for confidence interval 95%.
