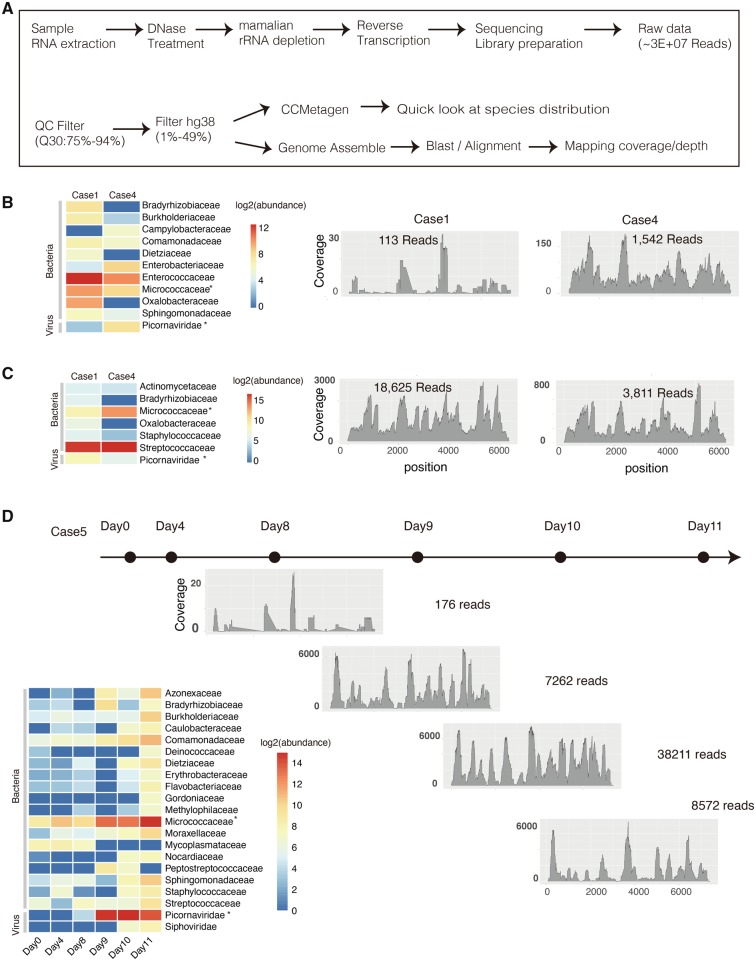
Figure 1.
Metatranscriptomics analysis on different samples types from the three fatal cases. (A) The workflow for metatranscriptomics NGS sequencing and sequencing data analysis. Anal (B) and oral swabs (C) were sampled from Cases 1 and 3 in autopsy diagnosis. The transcriptomes abundance of different microbe families in Cases 1 and 3 was investigated by CCMetagen. The relative coverage and depth at each position of E11 genome is shown by aligning sequencing data from Cases 1 and 3 to the E11 reference genome (KY981558); (D) Serial blood samples were collected from the fatal Case 5 at different time points (marked with black dots). The dynamic change of transcriptomes abundance of different microbe families was shown in left panel. The relative coverage and depth mapping to E11 genome were shown from Day 8. Micrococci and Picornavirus which were commonly identified in all types of samples with a relative high abundance were marked with asterisk.

