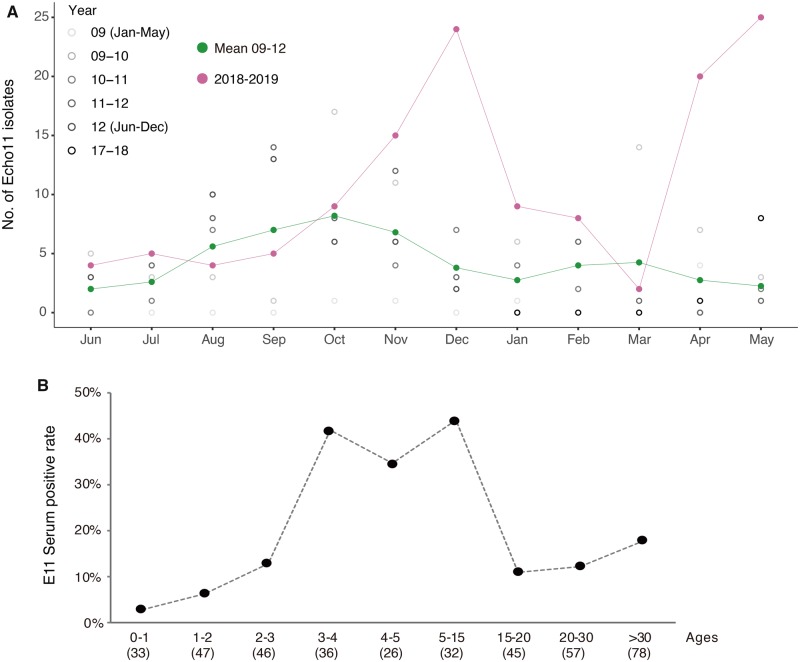
Figure 2.
Environmental surveillance and seroprevalence of E11. (A) The number of E11 isolates detected each month by cell-culture isolation from 2009 to 2012 and June 2018 to May 2019. To clearly illustrate the seasonal pattern and the increase in E11 circulation between 2009 and 2012, the number of E11 isolates from 2009 to 2012 were marked with black dots of a gradient color and presented between May to next June for each season. The mean number of E11 isolates from 2009 to 2012 and number of E11 isolates from 2018 to 2019 were marked with green line and magenta line, respectively. (B) Seroprevalence of neutralizing antibodies to E11 in different age groups of population in Guangdong, China. The number of serums tested for each group was shown in brackets.

