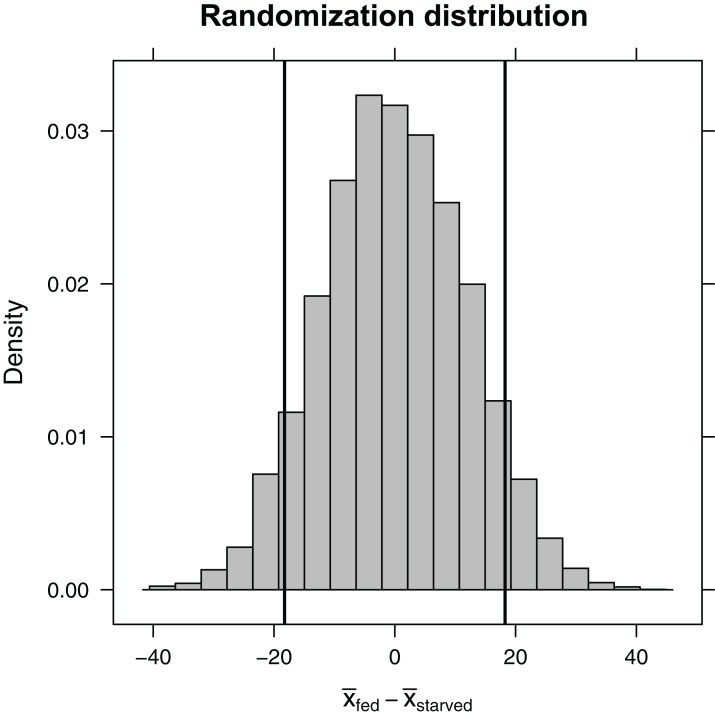
Figure 5. Randomization distribution for the difference in mean waiting time until mating formed by shuffling treatment assignments (fed versus starved) among cases.
This distribution informs us of the types of statistics (difference in means) that we would expect to see if the null hypothesis were true. Our observed sample statistic (starved − fed = −18.3, is indicated by the leftmost vertical line. When the null hypothesis is true, we would expect to get a difference in sample means ≤ −18.3 or ≥ 18.3 13% of the time (i.e., the p-value is 0.13).

