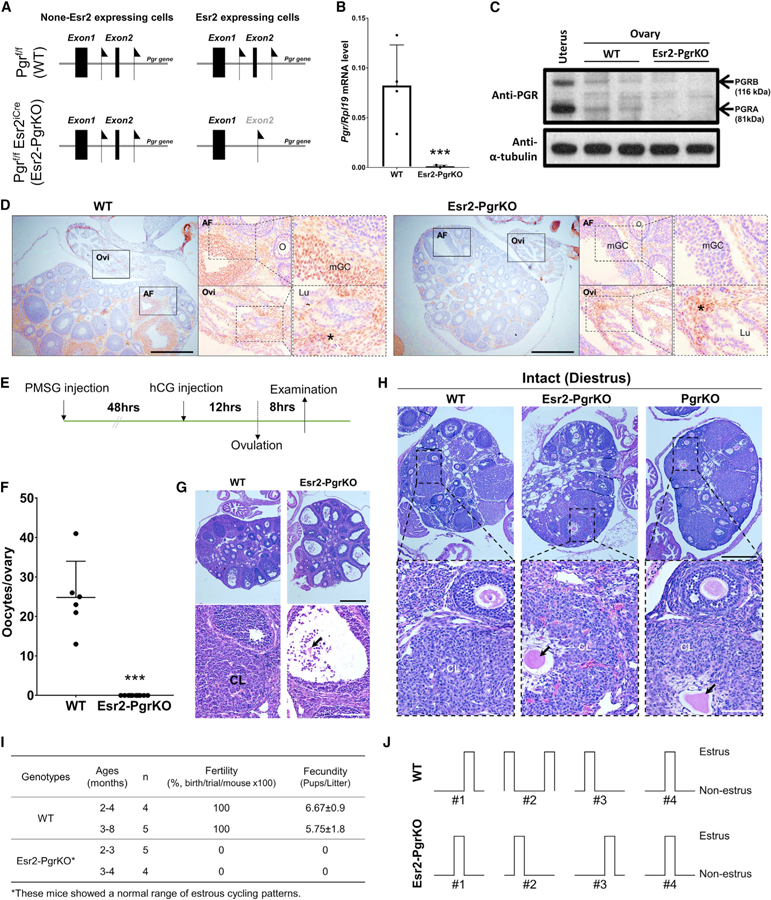
Figure 1. Pgr Expression Is Selectively Lost in the Granulosa Cells of the Esr2-PgrKO Ovary.

(A) Location of Loxp sequence in exon 2 in the Pgr gene of Pgrf/f and double transgenic Pgrf/fEsr2iCre mice.
(B) Ovarian Pgr mRNA expression in WT and Esr2-PgrKO at 3 h after hCG injection. Real-time PCR was performed using Pgr-specific primers. Rpl19 was also amplified as an internal control. Error bar, SD (n = 4); ***p < 0.001 (Student’s t test).
(C) PGR protein expression in WT and Esr2-PgrKO ovaries at hCG 6 h. The uterus was included as a positive control for PGR expression.
(D) Immunohistochemistry for PGR in WT and Esr2-PgrKO ovaries at hCG 6 h. Brown color represents the sites of the PGR localization. AF, antral follicles; Lu, lumen; mGC, mural granulosa cells; O, oocytes; Ovi, oviduct. Asterisks indicate the PGR-expressing interstitial cells in ovaries (scale bars, 0.5 mm).
(E) Timeline of PMSG and hCG injection for ovulation induction in 24-day-old mice.
(F) Number of ovulated oocytes was counted at 20 h after hCG injection from the oviduct. Error bar, SEM (n = 6, WT; n = 10, Esr2-PgrKO); ***p < 0.001 (Student’s t test).
(G) Histology of ovaries by H&E staining at hCG 20 h. CL, corpus luteum; arrow indicates the entrapped oocyte in CL (top scale bar, 0.5 mm; bottom scale bar, 100 mm).
(H) Entrapped oocytes in corpora lutea in Esr2-PgrKO and global PgrKO ovaries. Ovaries and reproductive tract tissues were collected from 45- to 52-day-old WT, Esr2-PgrKO, and global PgrKO mice during diestrus and were subjected to H&E histology. Arrows indicate entrapped oocytes in a CL. Note the presence of the lighter staining, larger lutein cells around the oocytes compared to the granulosa cells around adjacent oocytes in developing follicles (top scale bar, 0.5 mm; bottom scale bar, 100 mm).
(I) Fertility and fecundity tested in different age groups of mice. Data presented with mean ± SEM.
(J) Representative estrous cyclicity determined by vaginal cytology for 10 days (n = 4).
