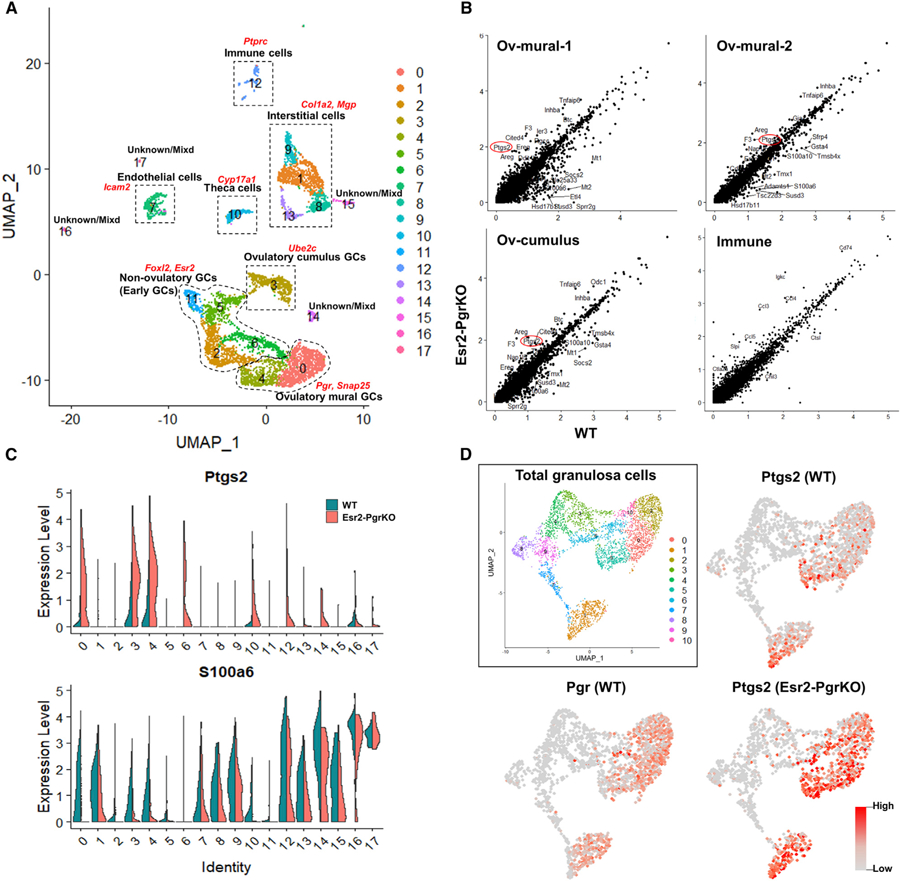
Figure 2. Upregulation of Ptgs2 Expression in Esr2-PgrKO Granulosa Cells.

(A) UMAP clustering identified 18 different cell clusters in the mouse ovary. Dotted lines show major cell populations that were identified by the expression of marker genes (red characters).
(B) Differentially expressed genes (DEGs) of ovulatory mural granulosa cells (Ov-mural-1 and −2), ovulatory cumulus cells (Ov-cumulus), and immune cells (Immune) were marked in scatterplots. Red circles indicate Ptgs2, which is upregulated in Esr2-PgrKO (KO) compared to WT. Blue circles indicate inflammation-related genes that are upregulated in KO compared to WT.
(C) Violin plots show the expression levels of Ptgs2 and S100a6 in ovarian cell clusters. Expression of Ptgs2 and S100a6 are increased and decreased in ovulatory granulosa cells (clusters 0, 3, and 4), respectively.
(D) UMAP plot in the solid box shows sub-clusters of granulosa cells. Feature plots for Pgr and Ptgs2 in WT and KO show the exclusive expression pattern of Pgr and Ptgs2 mRNA in granulosa cells.
