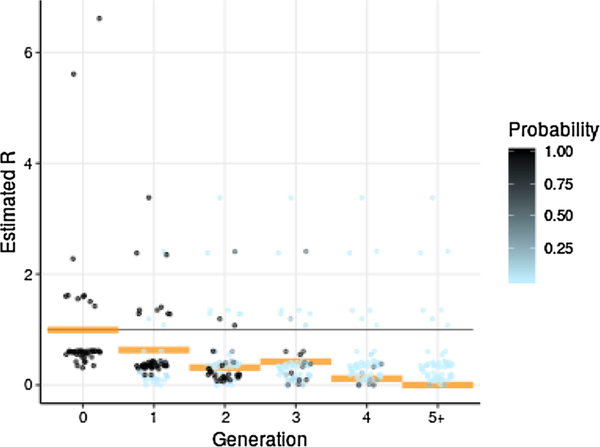
Fig. 6.
Estimated reproduction number R by generation and estimated probability of generation membership per case. Mean estimated R by generation is plotted as orange bars, and probability of membership of each case in each generation is plotted as dots shaded from light blue to black. Points of probability zero are omitted. Note that there are relatively few points of probability near ½. Note also the similarity between estimated R by generation and estimated R by two-week period (Fig. 3). Because of this similarity, this paper focuses on estimation of R by generation, while estimation of R by date is a potential subject of future research. (Fig. 7).

