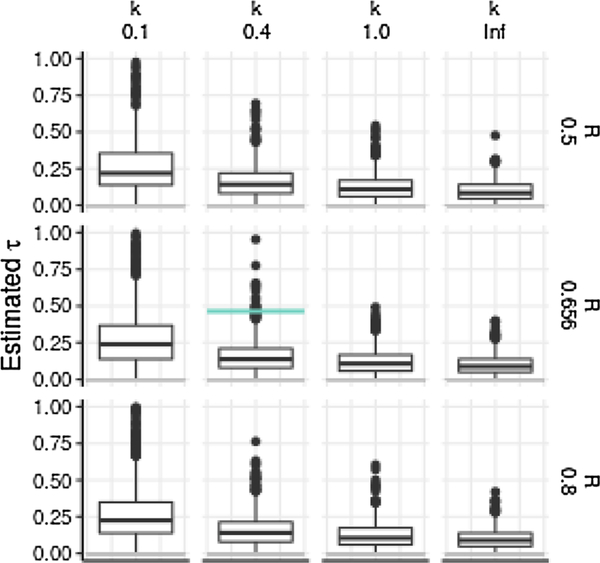
Fig. 7.
Distribution of estimates of rate of decline of R by generation in simulations with constant R, against true R (top to bottom) and k (left to right). Rates of quenching of transmission obtained by fitting function R = Rie−τm to Wallinga-Teunis estimated R by generation m in simulated outbreaks, conditioned on outbreak size of 131 cases. Horizontal gray line shows the true value τ = 0, and horizontal colored line shows quenching rate estimated for Disney outbreak, illustrating the significance test reported in the text. Boxes mark median and interquartile range of estimates. The k = 0.1 case includes outliers not shown.

