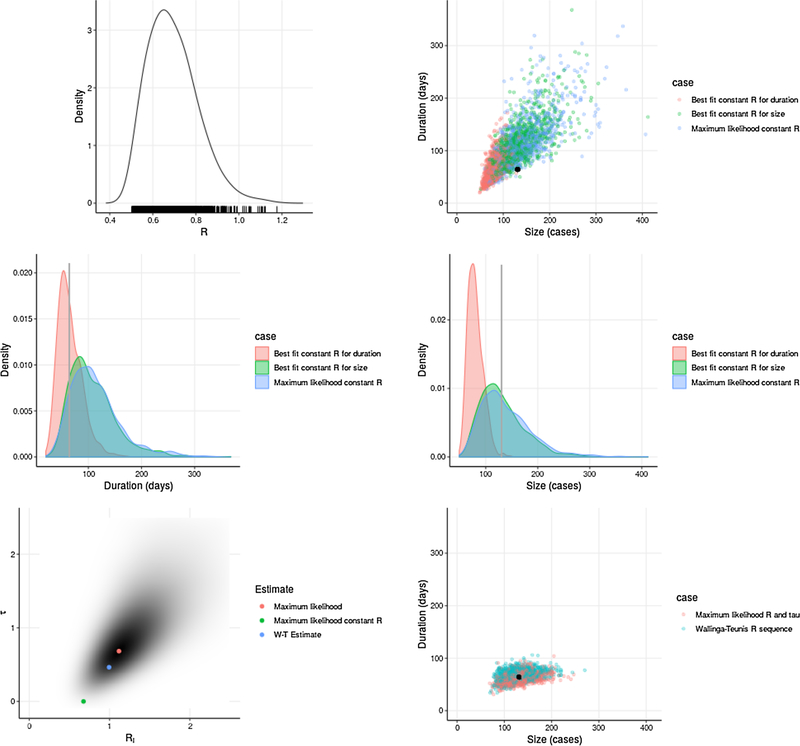
Fig. 8.
Size and duration in branching processes with constant R and with quenched R, compared to Disney outbreak. (Top left) Likelihood of outbreak size within 5 cases and duration within 5 days of Disney measurements in simulation with constant R; (Top right) Distribution of size and duration given maximum likelihood constant R, constant R fit to Disney outbreak duration only, and constant R fit to Disney outbreak size only (black dot is size and duration of Disney outbreak); (Middle left) Distribution of outbreak duration given three constant R estimates (vertical line is duration of Disney outbreak); (Middle right) Distribution of outbreak size given three constant R estimates (vertical line is size of Disney outbreak); (Bottom left) Likelihood surface for Ri and τ parameters describing quenched and unquenched R; (Bottom right) Distribution of size and duration given maximum likelihood quenched R and quenched R sequence estimated by Wallinga-Teunis method (black dot is size and duration of Disney outbreak). Simulated with k = 0.40.

