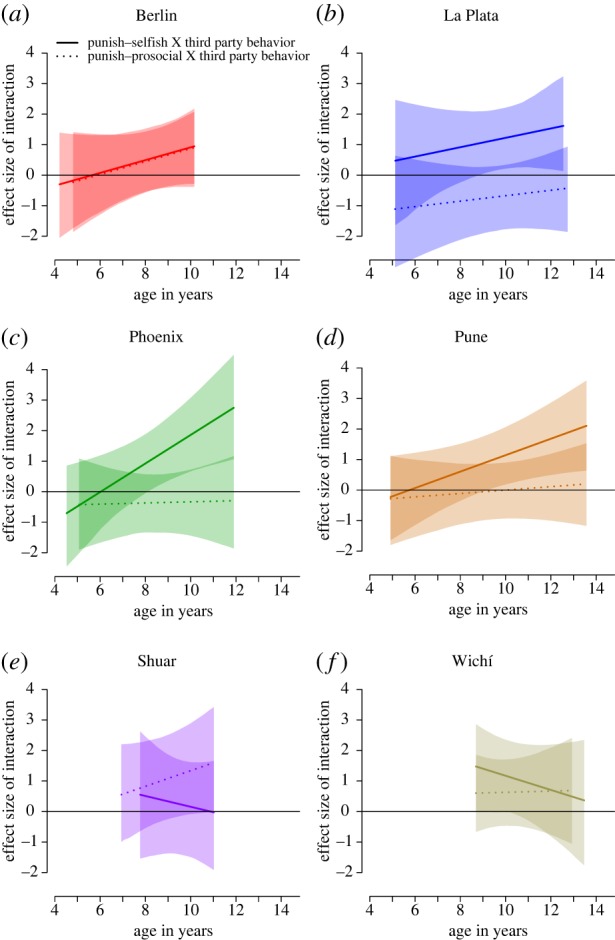
Figure 4.

Effect sizes of regression coefficients for the interactions ‘Punish-Selfish prime × Third-Party Behaviour’ and ‘Punish-Prosocial prime × Third-Party Behaviour’, plotted as a function of child age. These capture the degree to which the two directed norm primes (Punish-Selfish and Punish-Prosocial) increase or decrease children's bias towards punishing selfish third parties more than prosocial third parties, relative to that bias in the Punish-Either prime condition. Solid lines represent the estimated probabilities for the Punish-Selfish prime (i.e. ‘Punish-Selfish × Third-Party Behaviour’ interaction) and dashed lines represent the estimated probabilities for the Punish-Prosocial prime (i.e. ‘Punish-Prosocial × Third-Party Behaviour’ interaction). Shaded regions represent 95% confidence intervals for these estimates. Where the lines are reliably above zero (b,c,d), this indicates that the prime (either Punish-Selfish or Punish-Prosocial) has reliably increased children's bias towards punishing selfish third parties more than prosocial third parties, above children's bias towards this in the Punish-Either prime condition. (Online version in colour.)
