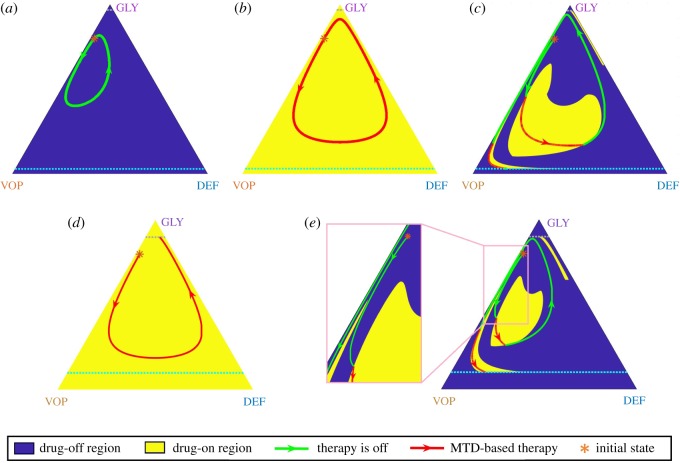
Figure 4.
MTD-based policy versus the optimal (adaptive) policy when the MTD rate is low (). Top row: trajectories under both (a) ‘no therapy’ policy and (b) the MTD-based policy are cyclic and cannot cross either the recovery or the failure barrier from the initial state denoted by (*). Nevertheless, the adaptive/optimal switching leads to a full recovery (c). Bottom row: With a larger failure zone, an MTD-based policy leads to patient’s putative death (d) even though it is still possible to cross the recovery barrier under an adaptive/optimal policy (e). (Online version in colour.)

