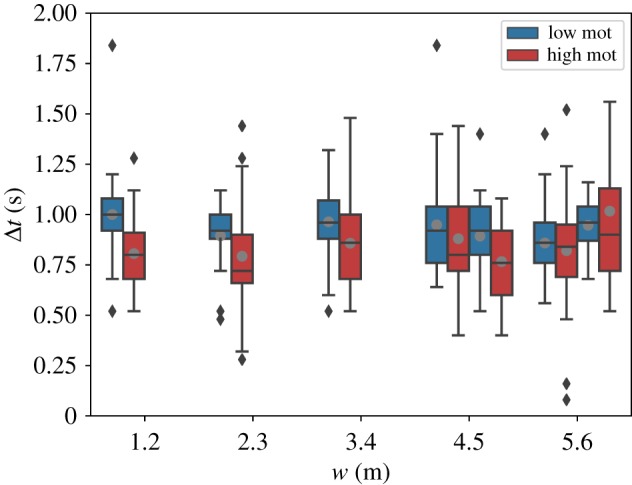
Figure 9.

Boxplot representation of time gaps Δt between consecutive persons crossing the target line within the bottleneck for each run with N > 40. The first and last 10 people crossing the target line were omitted. Grey dots: mean values; diamonds: outliers.
