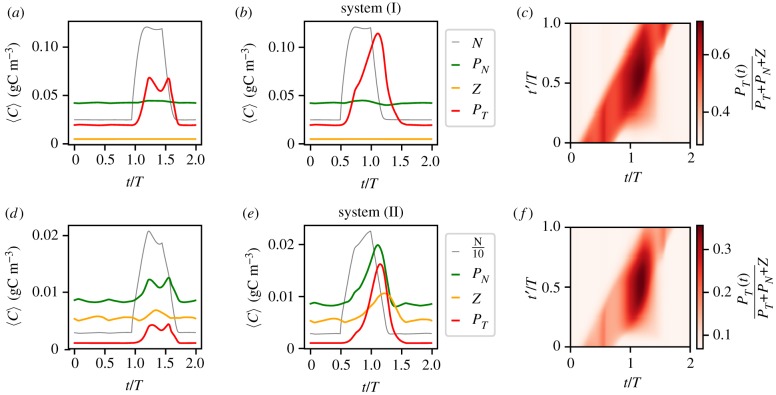
Figure 7.
(a,b,d,e) Two possible responses of the population dynamics to the influx of nutrients through upwelling events (δ = 0.5 T) initiated at: (a,d) t′ = 0.95 T and (b,e) t′ = 0.5 T. (c,f ) The time evolution of the relative biomass of the toxic species following upwelling events. The top panels (a–c) represent the results for system (I) and the bottom panels (d–f ) for system (II).

