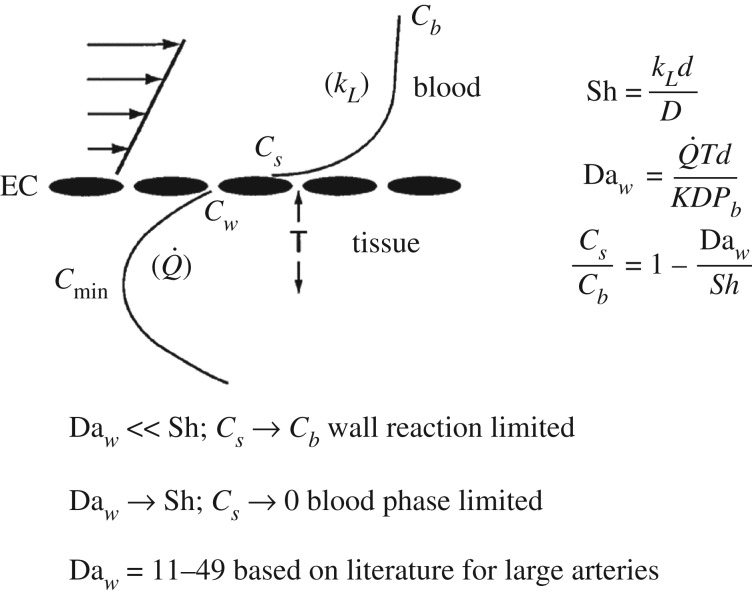
Figure 4.
Outline of simplified mass transport considerations for oxygen transport to a blood vessel wall. The schematic displays the concentration profile from the bulk blood (Cb) to the endothelial cell surface (Cs) to the inner wall (Cw) and the minimum value (Cmin) as indicated in figure 2. kL is the fluid phase mass transport coefficient, is the oxygen consumption rate and T is the distance to Cmin—roughly ½ the wall thickness. The velocity profile at the left is linearized because of the thin concentration boundary layer (Leveque approximation) [81].

