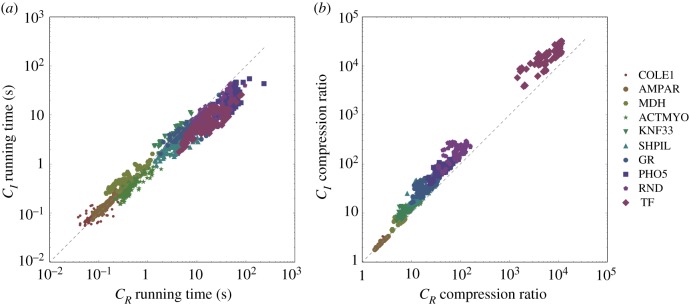
Figure 5.
Running time (a) and compression (b) of algorithms CR and CI on the collection of less complex examples in electronic supplementary material, table S1. Each point represents the running time/compression for an example graph obtained by CR and CI using the same connectivity-informed heuristic. The dashed line marks equal performance for CR and CI. Examples are sorted by complexity (number of spanning trees): COLE1 has the lowest complexity and TF the highest.

