
Figure 6.
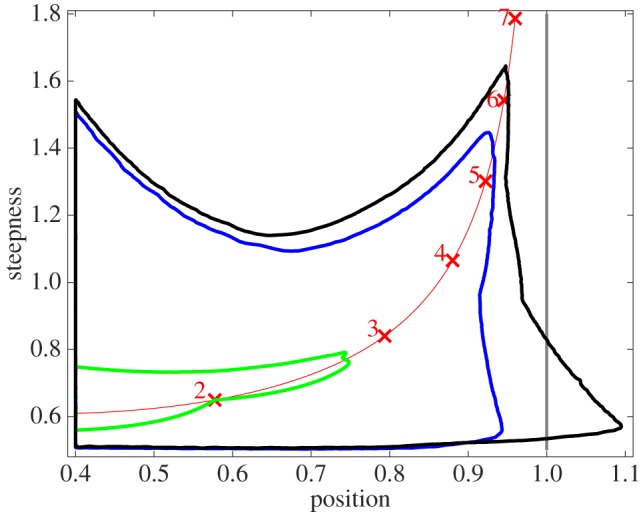
Position-steepness regions for non-equilibrium gene response functions corresponding to models with n = 2 (green), n = 3 (blue), n = 4 (black) transcription factor binding sites. The boundaries are obtained for the all-or-nothing expression strategy by sampling parameter values in the interval [103, 10−3]. The Hill line defined by the position-steepness loci of Hill functions with coefficients ranging from 1.5 to 7 is shown in red; loci corresponding to integer Hill coefficients are marked with red crosses and numbers. The position asymptote of the Hill line is marked in grey.