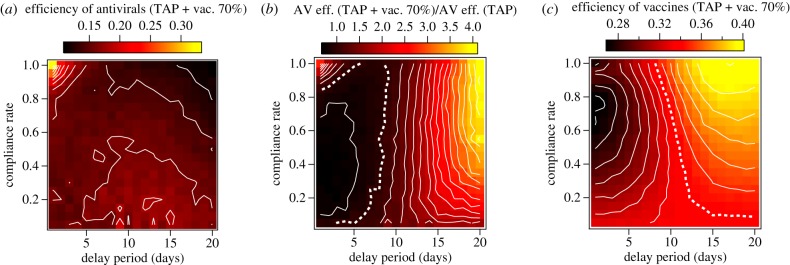
Figure 5.
Image plots demonstrating component efficiencies determined for the TAP protocol and pre-pandemic vaccination, when they are applied together. (a) The efficiency attributed to antivirals when they are combined with a 70% vaccination programme. (b) The ratio of the component efficiency of antivirals in the combined strategy and the raw efficiency of antivirals in the TAP protocol alone. The dotted white contour in (b) highlights a ratio of 1, where the combination of TAP with vaccination does not change the per-course suppression for antivirals. (c) Illustration of how vaccine efficiency scales with TAP compliance and delay period. The dotted white line highlights a component efficiency value of 0.34, the suppression per vaccine computed for 70% vaccination alone (figure 1).

