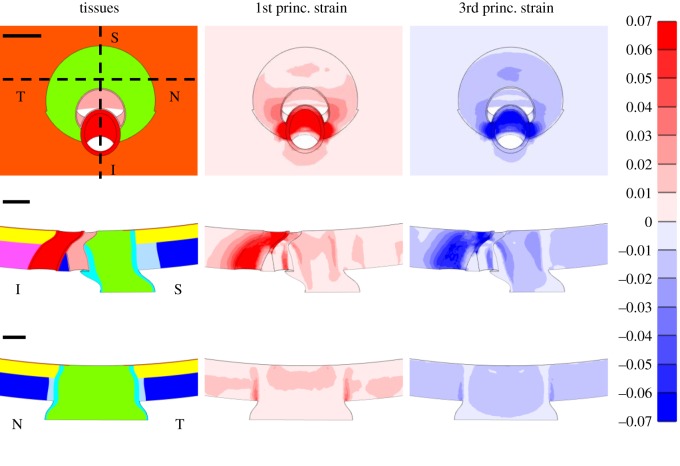
Figure 4.
First and third principal strains in the baseline model at an IOP of 25 mm Hg. The en face view (top row), superior (S)–inferior (I) slice (middle row) and nasal (N)–temporal (T) slice (bottom row) are shown. Scale bars shown in the left column are all 100 µm. The superior–inferior and nasal–temporal slices are indicated by the dashed lines in the en face view displaying the model tissues. Tissue colours are the same as in figure 2. The undeformed configuration is shown in all images to ensure that a consistent slice through the model is shown across columns.

