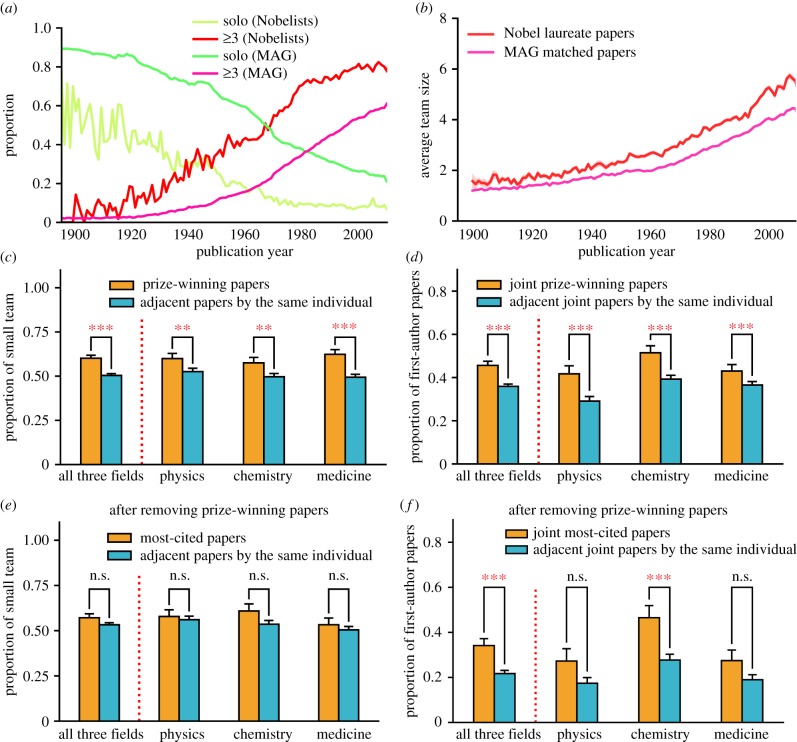
Figure 3.
Collaboration patterns. (a) A comparison of the proportion of single-authored papers and large-team-authored papers between Nobelists' papers and all MAG papers as a function of the publishing year. The last century saw a decline in the fraction of single-authored papers and an increase in large team collaboration. Moreover, Nobel laureates tend to have a smaller fraction of single-authored papers and a larger fraction of big team papers. (b) Team size of Nobel laureates’ papers and matched papers as a function of the publication year. For each Nobel laureate's paper, we matched 20 papers with the same publication year, same specific field and the closest number of citations for comparison. It shows that the team size of Nobel laureates’ papers is always larger than random. (c) The proportion of small team-sized papers (team size ≤2) for all the prize-winning papers and the null model. For each prize-winning paper, we chose four non-prize-winning papers with the closest publication time by the same individual as a null model. (d) The proportion of first-authored papers of joint prize-winning papers in comparison with a null model. In this case, we only consider joint-authored papers. For each joint-authored prize-winning paper, we chose four joint-authored non-prize-winning papers published by the same Nobel laureate with the closest publication time. (e) We also measure the proportion of small team-sized papers for the most-cited papers after removing the prize-winning papers before the prize in comparison with a null model. For each most-cited paper, we chose four papers published by the same Nobel laureate with the closest publication time as the null model. (f) We then compare the proportion of first-authored papers among joint most-cited papers after removing the prize-winning papers before the prize with a null model, and we chose four joint-authored papers published by the same Nobel laureate with the closest publication time as the null model. ***p < 0.01, **p < 0.05, *p < 0.1 and n.s. (not significant) for p > 0.1. Error bars represent the s.e.m.

