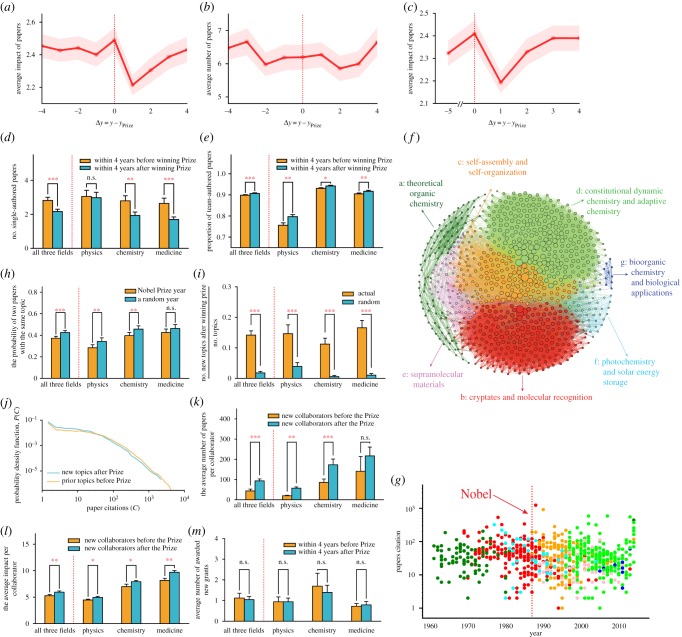
Figure 4.
After the Nobel Prize: the temporary dip and bounce back. (a) Average impact per paper (defined in equation (4.4)) as a function of time. The year when the Nobel Prize is given is marked as 0. For each laureate, we calculate the average impact of papers the laureate published in each of the 4 years before and after the Nobel Prize, as well as the prize-winning year. The solid line indicates the average across all laureates in our sample, with the shaded area denoting the standard error of the mean. (b) The average number of papers before and after winning the Nobel Prize. The solid line indicates the average across all laureates in our sample, with the shaded area denoting the standard error of the mean. The change following the Nobel Prize mainly pertains to impact rather than productivity. In contrast with the common belief of decreased productivity following the Nobel Prize, the average number of publications by the laureates shows no significant changes. (c) Average impact per paper as a function of time. We set the observation window as 5 years and calculate the average impact of papers based on the 5 year citation counts. For each laureate, we compare the average impact of papers published in the 5th year before and each of the 4 years after winning the Nobel Prize. (d) Comparison of the number of individual papers within 4 years before and after receipt of the Nobel Prize. It shows a significant decrease in individual work after the Nobel Prize. The change is significant for chemistry and medicine, while there is no significant difference for physics. (e) Comparison of the proportion of joint papers within 4 years before and after the prize. It shows an increase of joint works after the Nobel Prize. (f) Communities of topics for Nobel laureate Jean-Marie Lehn. Each paper is represented by a node, and two papers are connected if they share at least one reference; thus, constructing a co-citing network. Here, communities are detected using the fast unfolding algorithm [43,55], and each community represents a research topic. (g) The time series of all the papers published by Nobel laureate Jean-Marie Lehn; the Y-axis shows the citation for each paper. Each paper is represented by a point and the colour corresponds to the topic community in the co-citing network. It shows a clear topic switching from ‘cryptates and molecular recognition’ to ‘self-assembly and self-organization’ for Nobel laureate Jean-Marie Lehn immediately after winning the Nobel Prize. (h) Comparison of the probability of two papers belonging to the same topic within 4 years before and after the reception of the prize and a random year. The probability is significantly lower after winning the prize, suggesting that Nobel laureates tend to shift research topic after winning the Nobel Prize. (i) We measure the chance of Nobel laureates shifting to a new topic after winning the Nobel Prize, by no. new topics after winning the prize/no. topics. We also shuffled the topic of the works and repeated the measurement as a null model, finding that the laureates are much more likely to shift to a new topic after winning the Nobel Prize than random (14.2% versus 1.8%, p-value < 10−14). The change is significant for physics and chemistry, while there is no significant difference for medicine. (j) The distribution of paper citations for prior topics before the Nobel Prize and new topics after the Nobel Prize. We use the Kolmogorov–Smirnov measure to compare the two distributions, finding that papers of the prior topics receive higher citations than those of the new topics after the prize (Kolmogorov–Smirnov test, p-value < 10−71). (k) Comparison of the average number of papers of new collaborators before and after the Nobel Prize, showing post-prize collaborators tend to be more productive (Student's t-test, p-value < 10−3). (l) Comparison of the average impact of new collaborators before and after the Nobel Prize, showing post-prize collaborators tend to have a higher impact (Student's t-test, p-value = 0.02). (m) Comparison of the average number of awarded new grants within 4 years before and after winning the Nobel. There is no significant change in funding before and after the prize (Student's t-test, p-value = 0.77). ***p < 0.01, **p < 0.05, *p < 0.1 and n.s. (not significant) for p > 0.1. Error bars represent the s.e.m.

