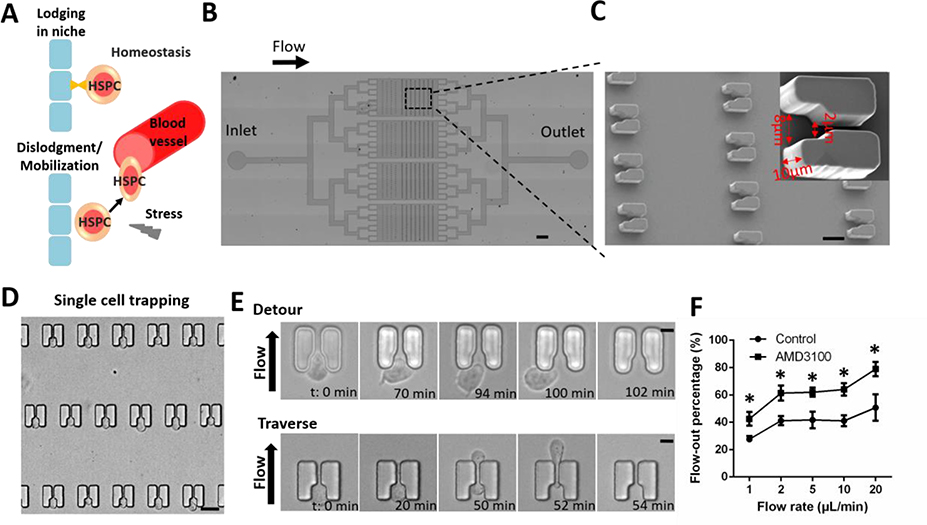
Figure 1. High-throughput analysis of single-HSPC motility using microfluidic cell trapping arrays.
(A) Model of hematopoietic progenitor cell or HSPC trafficking in the endosteal niche. HSPCs are located within specialized niches in the bone marrow. Certain circumstances induce the mobilization of HSPCs from the bone marrow into peripheral circulation. (B) Structure of the microfluidic device. The arrow indicates flow direction from the inlet to the outlet. Scale bar: 0.5 mm. (C) Scanning electron micrograph of single-cell trapping structures. Scale bar: 15 μm. Inset shows an individual 10 μm-high trap structure with an 8-μm inlet and a 2-μm outlet. Trap dimensions are indicated with red arrows. (D) Cell trapping was visualized by microscopy after HSPCs were loaded into the device. Scale bar: 15 μm. (E) HSPCs exhibited motility at the trap sites and exited the structures either by detouring at the inlet (Detour) or traversing the structure through the outlet (Traverse). Scale bar: 5 μm. (F) Percentage of loaded HSPCs flowing out of the chip in the absence or presence of AMD3100 (20 μg/ml). For each experiment, a total of ~150 cells in each device were analyzed to calculate the flow-out percentage in the absence or presence of AMD3100. Data are presented as mean ± s.d. from three different experiments (n=3, measured three times, for each group). *P < 0.01 determined by a two-tailed Student’s t test.

