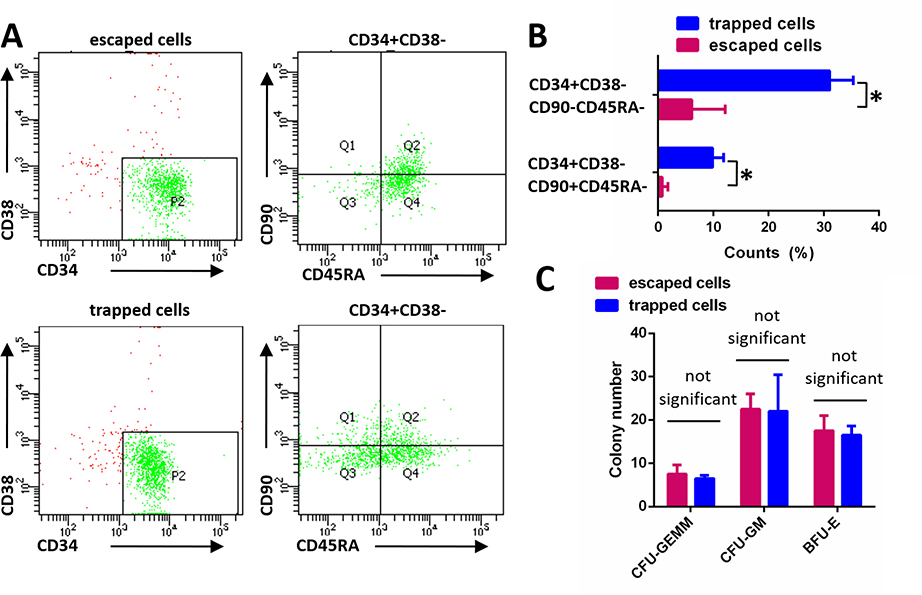
Figure 2. Sorted hematopoietic progenitor cell populations exhibit different motile behaviors.
(A) HSPC marker expression in trapped and escaped cells was assessed using flow cytometry. (B) The percentages of CD34+CD38-CD90+CD45RA- and CD34+CD38-CD90-CD45RA- high progenitor cell populations in the trapped and escaped cell groups were assessed using flow cytometry. Data are presented as mean ± s.d. from three different experiments (n=3, measured three times, for each group). *P < 0.01 determined by a two-tailed Student’s t test. (C) Trapped and escaped cells were cultured in StemMACS™ HSC-CFU for 18 days, and hematopoietic progenitor CFUs were classified based on morphology and quantitated. CFU-GEMM: common myeloid progenitor; CFU-GM: granulocyte-macrophage progenitor; BFU-E: erythroid burst-forming units. Data are presented as mean ± s.d. from three different experiments (n=3, measured three times, for each group).

